Characterization and prediction of the Mid Summer Drought in the Tempisque river basin, North of Costa Rica, Central America, using ENSO and AMO relationships
Eric
Alfaro
Center for Geophysical Research, Center for Research in Marine Sciences and Limnology and School of Physics, University of Costa Rica
Poster
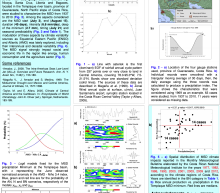
On the Pacific slope of Central America, the precipitation annual cycle is characterized by two rainfall maxima in June and September-October, an extended dry season from November to May, and a shorter reduced precipitation period during July–August known as Mid-Summer Drought (MSD) or “veranillo”, during July, the magnitude of trade winds increase and this is associated also with the Caribbean Low Level Jet. Four daily gauge stations records, e.g. Nicoya, Santa Cruz, Liberia and Bagaces, located in the Tempisque river basin, province of Guanacaste, North Pacific slope of Costa Rica, were studied to characterize the MSD from 1937 to 2010. Among the aspects considered are the MSD start (July 3), end (August 15), duration (45 days), intensity (6.6 mm/day), deep of the minimum (2.7 mm), timing (July 21) and seasonal predictability. The modulation of these aspects by climate variability sources as Equatorial Eastern Pacific (ENSO) and Atlantic (AMO) was lately explored, including their interannual and decadal variability. The MSD signal strongly impact social and economic life in the region like energy, human consumption and the agriculture sector
AlfaroGuayaquil2014.pptx_.pdf
(2.46 MB)
Session III: Weather and climate extremes in the Americas
Number of comments: 9
Comments
Comment by: Vasu Misra
August 31, 2015 - 1:12pm
Hi Eric,
I have a few questions on this poster:
1. What is below and above normal MSD? Does the below normal MSD mean the drought is more severe than climatology?
2. What is Atlantic-Nino3 index gradient? If it is the TNA-Nino3 SST gradient then isn't there a mix up of scales because Nino3 is dominated by interannual variations while TNA has got many more dominant scales?
3. Why is the U wind minimum at MSD in your figure contrary to what is stated in text that winds increases during MSD?
Comment by: Eric Alfaro
August 31, 2015 - 1:50pm
Hi Vasu, and thank you for your comment. Regarding your observations:
1) Yes, it means that in Table 1, precipitation at the minimum of the event is in the lower tercile, so in the lower values, meaning that drought is more severe than climatology.
2) Is the normalized June difference between AMO and Niño 3.4 indices, and you are right different scales of variability could be present in these indices, dominating some periods and modulating also the MSD strength.
3) Notice that Fig. 1b is zonal wind, negative values mean easterly (westward) winds, and so the plot shows that in July, easterly winds are stronger at this meteorological station.
Comment by: Teddy Allen
September 6, 2015 - 4:08pm
Eric,
Thank you for presenting this poster about the MSD. I am very interested in understanding more about the MSD onset and possible predictability and applications.
I have just three questions for you:
1) How did you calculate your MSD intensity for figure 4?
2) Could you provide a brief interpretation for the wavelet diagrams?
3) Is rice production sensitive to July rains or more sensitive to annual or seasonal rains? Does rainfall in July really affect annual rice production? And if so, are you aware of any adaptive measures that rice farmers take during July?
Thank you!
Comment by: Eric Alfaro
September 7, 2015 - 12:07pm
Hi Teddy, and thank you for your questions. Regarding your questions:
1) I associate the word intensity with the average precipitation observed during the events (mm/day).
2) Briefly, there were observed signals around 3 and 8 years in both series. I should explore this in the future.
3) I just explore the relationships between rain at the minimum of the events and annual rice production. But other studies, by the people of Costa Rican Met service had shown that is also related with ENSO signal. Around July, rice producers make the second rice crop of the year and not all of them has irrigation systems. This could be the relationship between ENSO rain during MSD and its effect in the annual rice production. There is not a structured adaptation measurement to climate variability around the country for agriculture. Last year the government intensify the pumping and arrange economic help for the sector to minimize economic losses (see Amador, J. A., H. G. Hidalgo, E. J. Alfaro, Ana M. Durán, B. Calderón, and C. Vega, 2015. Central America. [In State of the Climate 2014], Bull. Amer. Met. Soc.; 96(7), S174-176). Agriculture is one of the sectors that participates in the regional forums that explains climate predictions to different socioeconomic sectors in Central America, but the interpretation of this information is not reaching in my opinion to end users and/or there is a lack of knowledge in how to interpret the climate information by them, affecting also the decision making process. Central America knew about the dry scenario for the Pacific coast since the RCOF of April 2014 held in Guatemala City.
Comment by: Germán Poveda
September 8, 2015 - 1:27pm
Hi Eric,
1) Figure 1 refers to results from 337 points over or very close to land in Central America. Please include a description of these data. In-situ data? Satellite data? Source?
2) You offer an analysis of the effects of ENSO, and AMO over different features of the MSD (start, end, duration, intensity, deep, minimum, timing (July 21) and seasonal predictability), but no conclusions are drawn from the analysis presented.
3) Given that you seem to have a long data set (from 1937 to 2010), it would be worth exploring the possible effects of climate change on the aforementioned features of the MSD, as for instance decadal variations and trends.
4) Please improve the conclusions of your study.
Comment by: Eric Alfaro
September 9, 2015 - 9:09am
Hi German, and thank you for your comments. Regarding your observations:
1) Data are merge from different sources. For this point, please visit http://iridl.ldeo.columbia.edu/SOURCES/.UNAM/.gridded/.monthly/.v0602/o…
2) The only relationships found with statistical significance were for the intensity of the events and the precipitation at the minimum of them, with June AMO-Niño3.4 index. Most of the events are located in July-August, so, a classical prediction scheme can be used. Methodology and results were extended for more stations across Central American isthmus and since 2014, this is an input for the Central American Regional Climate Outlook Forums for seasonal prediction.
3) No trend with statistical significance were detected in the annual series of any of the aspects studied and associated with the MSD, but signals around 8 and 3 years were detected for the intensity of the events and the rain at the minimum. This aspect agrees with signals in the AMO-Niño 3.4 index used and could be related with climate variability in the Atlantic and Equatorial Pacific, respectively. This aspect should be explored in more detail in the future.
4) In brief, regarding normalized anomalies, when the Atlantic tends to be cooler (warmer) than Equatorial Pacific, MSD event tends to be drier (wetter), this is related with stronger (weaker) easterly winds across the isthmus. Spatial distribution of the impacts during the events are coherent with that idea, showing dryness in the Pacific slope and floods in the Caribbean slope.
Comment by: Christian Dominguez
September 11, 2015 - 12:45pm
Hi Eric,
I would like to ask how can you relate AMO phases with the MSD signal? because they have different timescales. On the other hand, the ENSO phases are more important in the monthly timescale.
Have you analyzed the PDO phases with the MSD signal?
Comment by: Eric Alfaro
September 11, 2015 - 3:13pm
Hi Christian, and thank you for your question. We create an annual index, making the difference between the monthly June indices of AMO and Niño 3.4. After that we used contingency tables and logit models to explore the MSD annual series with the index described before. I incorporated in the analysis the June PDO index but I didn’t find any relationship with those MSD time series having important statistical significance.
Comment by: Christian Dominguez
September 17, 2015 - 11:32pm
Hi Eric,
Thank you for your explanation!. Perhaps, you could explore a mixed relationship AMO vs PDO. I tried it a couple of years ago to explore the modulation of AMO & PDO with the tropical cyclone activity over IAS. Good to read you!