Evaluation of GPCP 1DD Precipitation Product Using NEXRAD Q2 Precipitation Estimates over the CONUS
Wenjun
Cui
University of North Dakota
Poster
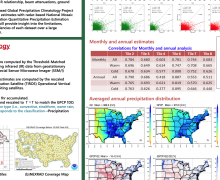
Although improvements have been made in satellite-based precipitation estimates, the ability of this technique is affected by several issues such as algorithm errors and sensor errors. This study evaluates the performance of Global Precipitation Climatology Project, 1 degree daily (GPCP 1DD) precipitation estimates over the Central and Eastern contiguous United States (CONUS) using National Mosaic and Multi-Sensor Next Generation Quantitative Precipitation Estimation System (NMQ Q2) estimates. Monthly accumulated precipitation, annual accumulated precipitation and spatial averages were computed based on daily estimates for selected regions during the period 2010-2012. The comparisons between the two datasets are conducted for both warm (April – September) and cold (October – March) seasons. GPCP 1DD estimates and Q2 estimates show good agreement for multiple temporal analyses and strong correlations (0.657-0.959) were found for spatial analyses. However, GPCP 1DD shows an inability to capture intense convective precipitation over central regions. Although the annual difference between Q2 and GPCP precipitation estimates is only 1.3%, there are large seasonal differences, such as an underestimation of 7.4% by GPCP during the warm season, and an overestimation of 8.3% during the cold season. The results from this study provide valuable insight on the strengths and weaknesses of GPCP product to its users.
Poster 3.pdf
(2.91 MB)
Session I: Identifying opportunities and challenges of observing and modeling IAS variability and its teleconnections
Number of comments: 4
Comments
Comment by: Vasu Misra
August 31, 2015 - 1:17pm
Hi Wenjun,
I was curious to know the time period used for your comparison between GPCP 1DD and NEXRAD Q2 precipitation?
In another poster presented by Johanna Yepes et al. (poster 7) in your session, they show comparison of GPCP with TRMM, CRU, CMAP over tropical South America and Central America. There seems to be large differences even there (in deep tropics)---is it likely that GPCP has bias in picking intense convective events in the tropics as well?
Comment by: Wenjun Cui
September 2, 2015 - 2:09pm
Hi Vasu,
Sorry I forgot to put the study period on my poster. It was during 2010-2012.
Compared to Q2, GPCP captured fewer intense precipitation events. It is likely due to the limitation in spatial and temporal resolutions of satellite instruments compared to radar. But I can't really say it is bias in my study since Q2 is not ground measurement, but a estimation product simply by applying Z-R relationships to cloud base reflectivities. According to Stenz et al. (2014), Q2 has a wet bias when estimating the precipitation from Deep Convective Systems (DCSs) compared to the Oklahoma Mesonet, so the apparent dry bias (respect to Q2) from GPCP may be relatively accurate compared to ground measurements.
Thank you,
Wenjun Cui
Comment by: Germán Poveda
September 8, 2015 - 2:12pm
Hi Wenjun,
In addition to correlations, it would be interesting to test for differences in the probability distributions functions of Q2 and GPCP products, perhaps a Smirnov-Kolmogorov test could provide differences among central moments.
Comment by: Wenjun Cui
September 9, 2015 - 1:21pm
Hi Germán,
Thanks for your suggestion. I actually did the PDFs and CDFs analysis of GPCP and Q2 but only for monthly mean estimates (mm/day). For central regions (mostly tile 6 and tile 7), Q2 has more samples with small precipitation values (less than 1mm/day) and also with large precipitation values (larger than 5mm/day) than GPCP. For GPCP estimates, samples were more concentrated between medium values.
Thank you,
Wenjun Cui