Observed (1970-1999) climate variability in Central America using a high-resolution meteorological dataset with potential for climate change studies
Eric
Alfaro
Center for Geophysical Research, Center for Research in Marine Sciences and Limnology and School of Physics, University of Costa Rica
Poster
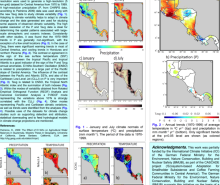
Average temperature (Tavg) data from stations and station-based gridded datasets at 50 km resolution were used to provide a high-resolution (5 km grid) dataset for Central America from 1970 to 1999. The procedure used was a modification of the PRISM (Parameter-elevation Regressions on Independent Slopes) method. A high-resolution precipitation (P) data was used along with the air temperature (Tavg) data to study climate variability. Adapting to climate variability helps to adapt to climate change. The high spatial resolution of the P and Tavg data is ideal for determining the spatial patterns associated with large-scale atmospheric and oceanic indexes. Consistently with other studies, it was found that the 1970-1999 trends in P are generally non-significant, with the exception of a few small locations. In the case of Tavg, there were significant warming trends in most of Central America, and cooling trends in Honduras and northern Panama. The contrast or agreement in the sign of the sea surface temperature (SST) anomalies between the tropical Pacific and tropical Atlantic is a good indicator of the sign of the P and Tavg annual anomalies. El Niño-Southern Oscillation (ENSO) is related to precipitation in a large part of the Pacific slope of Central America. The influence of the contrast between the Pacific and Atlantic SSTs, and also of the Caribbean Low-Level Jet (CLLJ) on P is very important. Tavg is related to ENSO, the Tropical North Atlantic index and the summation of both indexes. Within the modes of variability obtained from Rotated Empirical Orthogonal Function (REOF) Analysis and Canonical Correlation Analysis a P-REOF mode representing the variations above 10oN is strongly correlated with the CLLJ. Other modes representing Pacific and Caribbean climatic variations, as well as trends were identified from the analyses. Possible uses of the datasets for climate change studies such as supporting detection and attribution, statistical downscaling and to fit hydrological models in climate change projections are mentioned.
AlfaroSantiago2015v2_1.pdf
(2.22 MB)
Session I: Identifying opportunities and challenges of observing and modeling IAS variability and its teleconnections
Number of comments: 11
Comments
Comment by: Vasu Misra
August 29, 2015 - 7:15am
This is a nice poster. There is some confusion in the community about the influence of NTA-NINO3 SST gradient. I believe it seems to affect the annual anomalies of precipitation but has very little impact on the rainy season anomalies over Central America. The NTA-NINO3 gradient is strongest in late boreal winter and spring but relatively weak in the boreal summer and early fall seasons. Would you agree.
Comment by: Eric Alfaro
August 31, 2015 - 1:51pm
Dear Vasu, thank you for your comment. Since the pioneer work of Enfield and Alfaro (1999) was noticed that NTA-Niño SST gradient is very important in the modulation of the precipitation anomalies during the rainy season in Central America. This modulation is specially marked during late boreal summer and autumn, influencing important regional features of the annual cycle like the Caribbean Low Level Jet, the Mid-Summer Drought and the second peak of the rainy season on the Pacific slope of Central America. The atmospheric control is mainly through the strength of the easterly wind. The strongest response occurs when the tropical Atlantic is in the configuration of a meridional dipole (antisymmetric across the ITCZ) and the eastern tropical Pacific is of opposite sign to the tropical North Atlantic, in which positive & negative (negative & positive) SST anomalies in the Pacific & Atlantic Tropical oceans, tend to be associated with negative (positive) rainfall anomalies mainly at Central American Pacific slope. A recent paper on that is: Maldonado, T., E. Alfaro, B. Fallas and L. Alvarado, 2013. Seasonal prediction of extreme precipitation events and frequency of rainy days over Costa Rica, Central America, using Canonical Correlation Analysis. Advances in Geosciences, 33, 41-52.
Comment by: Eric Alfaro
August 31, 2015 - 11:20am
- Dear Vasu, thank you for your comment. Since the pioneer work of Enfield and Alfaro (1999) was noticed that NTA-Niño SST gradient is very important in the modulation of the precipitation anomalies during the rainy season in Central America. This modulation is specially marked during late boreal summer and autumn, influencing important regional features of the annual cycle like the Caribbean Low Level Jet, the Mid-Summer Drought and the second peak of the rainy season on the Pacific slope of Central America. The atmospheric control is mainly through the strength of the easterly wind. The strongest response occurs when the tropical Atlantic is in the configuration of a meridional dipole (antisymmetric across the ITCZ) and the eastern tropical Pacific is of opposite sign to the tropical North Atlantic, in which positive & negative (negative & positive) SST anomalies in the Pacific & Atlantic Tropical oceans, tend to be associated with negative (positive) rainfall anomalies mainly at Central American Pacific slope. A recent paper on that is: Maldonado, T., E. Alfaro, B. Fallas and L. Alvarado, 2013. Seasonal prediction of extreme precipitation events and frequency of rainy days over Costa Rica, Central America, using Canonical Correlation Analysis. Advances in Geosciences, 33, 41-52.
Comment by: Chunzai Wang
September 4, 2015 - 11:39am
Eric:
The high-resolution data are very important for the community. I am glad that your poster presents such dataset. Can you provide more information how the data are produced? Thanks.
Chunzai
Comment by: Eric Alfaro
September 4, 2015 - 3:55pm
Hi Chunzai Wang, and thank you for your interest. For precipitation visit the web site described in the poster at the references, that is not our product. About temperature, data for this article were constructed using a procedure for estimating gridded meteorological patterns using a method contained in Daly et al. (1994; 2002; 2008). Using a set of station data near the point of interest, the method performs weighted regressions between the station elevation and the value (monthly or daily) of the meteorological parameter. The weights are assigned according to several criteria referenced to the conditions of the point of interest and the stations. Originally, Daly et al. (2002) identified seven kinds of weights: distance (W(d)), elevation (W(z)), cluster (W(c)), vertical layer (W(l)), topographic facet (W(f)), coastal proximity ((W(p)) and effective terrain (W(e)). All weights and importance factors are normalized to unity individually and combined (Daly et al. 2002). For a detailed description of the procedure used here, we refer to Daly et al. (2002). The gridding model was used to produce meteorological variables at 5 km spatial resolution and at both, daily and monthly time scales.
Comment by: Germán Poveda
September 8, 2015 - 2:28pm
Hi Erik,
Given the importance of the mid-summer drought, it would be interesting to show your results for the two wet seasons and two dry seasons (Figure 1).
As any interpolated product, it is useful to have the error or estimation uncertainty maps handy.
Is per your answer to Chunzai, do you have a feeling (or estimates) about the relative importance of the different weights to explain the spatial variability of rainfall in Central America?
Comment by: Eric Alfaro
September 9, 2015 - 8:37am
Hi German, and thank you for your comments. Regarding your observations:
1) We actually computed individual climatological monthly maps for both variables to look at intra-seasonal variations. The paper is already submitted to Climatic Change, but we only included two months in the figure, to save space.
2) Thank you for your suggestion regarding showing the error. It can be addressed showing the error of the product with respect to raw station data, or we can show the error of the regression, for temperature, rain is not our product.
3) For this comment, please visit the web site in the references, notice that rain was interpolated using a different method.
Comment by: Jill Trepanier
September 9, 2015 - 12:44pm
Hi Eric,
First, great poster. Second, any idea how much of that July precipitation happens during hurricanes? Just curious if you are seeing a major difference in precipitation amounts from El Nino to La Nina years.
Thanks,
Jill
Comment by: Eric Alfaro
September 9, 2015 - 12:48pm
Hi Jill, interesting aspects, but we have not explore them, good suggestions for future lines. Thank you…
Comment by: Jill Trepanier
September 9, 2015 - 12:51pm
Great! Since I'm a hurricane junkie, my mind always goes there. Please consider me a source of info should you actually explore that idea.
Comment by: Eric Alfaro
September 9, 2015 - 1:06pm
Thank you Jill, an important aspect to define in that sense is how to separate just hurricane rain for the entire isthmus?
In spite that in absolute terms we didn’t quantify the differences of precipitation for La Niña and El Niño events, correlation analysis using the ENSO index showed that differences are significant.