Ocean-atmosphere variability related with the midsummer drought over Mexico and Central America in the CFSR reanalysis
Ivonne M.
García-Martínez
Centro de Investigación Científica y de Educación Superior de Ensenada, México
Poster
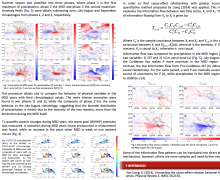
The midsummer drought (MSD) is a phenomenon characterized by a reduction in the amount of precipitation during the boreal summer season, usually observed in southern Mexico, Central America and adjacent ocean regions. In this study the spatial and temporal presence of the MSD is investigated by means of the Climate Forecast System Reanalysis (CFSR), which is a high-resolution coupled ocean-atmosphere reanalysis for the period 1979-2010 produced by the National Centers for Environmental Prediction (NCEP) of the USA. In contrast to previous products, the CFSR includes dynamics and data assimilation in the coupled ocean-atmosphere system as well as higher temporal and spatial resolutions. The analysis of anomalies and correlations of different atmospheric and oceanic variables reveals a series of interrelated processes that yield two maxima -and the relative minimum- of the summer precipitation. A different methodology to investigate anomaly fields is proposed, which provides additional information not captured by standard methods reported in the literature. This procedure allows comparing the behavior of physical variables in the MSD years with their climatological values. The seasonal migration of the Intertropical Convergence Zone and the intensification of the Caribbean Low Level Jet seem to be the key factors involved in the dynamics of the midsummer drought. A comparative analysis between the summer precipitation in the years with and without MSD points toward a new perspective of the mechanisms governing the MSD. The results strongly suggest that the MSD might be not only the result of a rain suppressor mechanism (as documented until now) but, in addition, that it might be a manifestation of the reinforcement of the rain at the beginning and at the end of the summer, which causes the two maxima that give the bimodal structure to the annual cycle of precipitation, defining the MSD.
Poster 9.pdf
(3.82 MB)
Session II: Ocean-Land-Atmosphere interactions of the Continental Americas and the Caribbean
Number of comments: 10
Comments
Comment by: Vasu Misra
August 31, 2015 - 6:45pm
Hi Ivonne,
Very interesting work. I have to learn more about cause-effect relationship. I don't quite understand the uncertainty argument-on how you are able to decipher that one variable makes the other more uncertain while the other way it is making it more stable or certain?
But I found it consistent with some of my own work that during the wet phases of MSD you found that the SST anomalies in both the Pacific and the Atlantic seem to have warm anomalies. But there are other studies which show that anomalous wet years in central America have a strong SST gradient (warm tropical Atlantic and cold Nino3 region). Is there an inconsistency in the interpretation of the influence of the SST gradient on rainfall anomalies over Central America?
Comment by: Ivonne García
September 1, 2015 - 9:15pm
Dear Vasu,
Thank you for your interest. Indeed, the interpretation of the causal relationships is not trivial. The easiest way to think about it is in terms of uncertainty. Considering two time series, X1 and X2, their causal relationship can be found with the formula for T2->1 (see the poster). If|T2->1|is nonzero, X2 is causal to X1; otherwise is noncausal. In the presence of causality there are two cases: a positive or a negative information flow. A positive T2->1 indicates that X2 tends to make X1 more uncertain, while a negative T2->1 means that X2 tends to stabilize X1. The examples in San Liang's paper help to clarify the idea (see reference in the poster). Our interest is to look for causal relationships and the results shown here are a first step. Significance tests are still missing. However, it is very interesting that the central Caribbean SST has a causal effect on the precipitation of the MSD region. This is something we have not seen so clearly in previous analysis.
Regarding your comments on the SST anomalies, consider that Fig. 3 shows that during wet phases, 1 and 3, the SST anomalies are negative, not positive, in the tropical Pacific (colder SST during years with intense MSD than their climatology). However, take into account that the composite anomalies are defined by considering only those years with a notorious decrease of the precipitation during midsummer (30% or more with respect to the highest maximum). We did so because we are interested on studying processes that occur during the different phases, and therefore we avoided averages over the whole rainy season. Thus, we cannot directly interpret the SST gradient between the Atlantic and the Pacific during wet years as in other studies (e.g. Fuentes-Franco et al., 2014).
Comment by: Chunzai Wang
September 4, 2015 - 10:53am
Ivonne:
I understand that you use a cause-effect method for studying the possible cause for rainfall. However, the method that you used is still a statistical method and it is hard to be proved by using data analyses only. You may consider to design numerical model experiments to test the results here.
Chunzai
Comment by: Ivonne García
September 5, 2015 - 2:24pm
Chunzai,
We completely agree. To give a physical explanation of the causal relationship, dynamical studies are needed. This statistical index, however, goes beyond standard correlation analysis (correlation does not imply causality, but this index does), something we found interesting to explore. The results shown here seem to be physically reasonable. Advances in dynamical studies related to sensitivity of the atmospheric circulation to SST in the southcentral Caribbean from regional simulations with WRF (Sarah Berthet) are included in the BAMS submitted paper of Misra et al.
Comment by: Danielle Groenen
September 4, 2015 - 11:40am
Dear Ivonne,
Your poster is very well done. I am curious about the composite MSD years versus non-MSD. Were there a lot of years where the MSD isn't present? What are those years and are they also ENSO years? Have you looked at other data besides the CFSR? I also study the MSD.
-Danielle
Comment by: Ivonne García
September 4, 2015 - 10:20pm
Hi Danielle,
In order to maximize the MSD signal, the 32 years of study were classified into two sets: 1) intense MSD years and 2) years where the MSD is weak or non-existent. We developed an algorithm based on relative differences between the maximum and minimum precipitation to carry out this classification as objectively as possible. In total, during the 1979-2010 period, only 17 rainy seasons satisfied the established criterion and therefore were considered as intense MSD years: 1979-1984, 1988, 1991-1993, 1995, 1997, 1999, 2000, 2003, 2004 and 2008. Within this 17 years, 6 showed ENSO (cold or warm phase) conditions: 1982, 1983, 1988, 1997, 1999 and 2000. While in the non-MSD set, 4 years were ENSO years: 1987, 1989, 1998 y 2010. Until now we have only worked with reanalysis data from the CFSR.
Comment by: Danielle Groenen
September 10, 2015 - 1:05pm
Hi Ivonne,
Thank you so much for the information. I am studying the interannual variability and find some interesting differences. 1993 and 2008 also were involved in the Midwest Atmospheric Rivers (ARs) events called the "Maya Express" (Dirmeyer and Kirtner 2009)...I am trying to study the relationship between these AR events and the MSD. 1994 seems to have no rainy season in the CPC data I am using, and I'm trying to figure out if that has something to do with the year or the data.
-Danielle
Comment by: Teddy Allen
September 8, 2015 - 11:35pm
Hola Ivonne,
Like the others above, I have an interest in learning more about mid-summer drying in the Caribbean. To me, the MSD is a period, not an event. Furthermore, I believe that the MSD period develops due the cessation of early season rains. Therefore, explaining the cessation of the early season rains may help to explain the onset of mid-summer drying during the MSD period. This to me represents the difference in thinking of the MSD as a period instead of an event. Thoughts?
The tendency for rain not to occur is the natural state of the atmosphere until uplift dynamics help to condense water vapor. Therefore, relatively weak rain-rates or low rainfall accumulation during the mid-summer evolves from weakened uplift dynamics relative to the early rain season. What is your opinion on this?
Also, how was phase 2 calculated? Since you are using biweekly data, could you afford to use sub-monthly time scales for figures 3-4?
I look forward to progressing our understanding of IAS rainfall variability together.
Thanks for sharing!
Comment by: Ivonne García
September 10, 2015 - 11:25am
Hola Teddy,
Thank you for your comments. We think we agree with you. The MSD is a big negative anomaly when looking at anomalies with respect to the mean summer rainfall. Our analysis, however, suggests that the low rainfall period (MSD) is not that different every year and what varies substantially is the strength of the two maxima before (usually May-June) and after (Sep-Oct) the MSD. This is also the view of Karnauskas et al. (Atmosfera, 2013 vol 26(2)) although we do not necessarily agree with their explanation. So the MSD is indeed "a period” of the seasonal cycle. Understanding how it begins and ends is why we are all in this meeting, are we not? Not sure anyone thinks the MSD is an “event” though.
We are not sure we fully understand or agree with your first statement. Moisture and its dynamics including uplift and rainfall are a basic element of the physics of the atmosphere. Are you suggesting that a moist atmosphere in thermodynamic equilibrium would have no rain? What do you mean by “natural state of the atmosphere"? Again the reason (reasons) why the MSD comes about is what we all are trying to understand and is certainly related to the processes that cause the demise of the first rainfall maximum. It is one of the basic issues discussed in the literature.
Regarding your question on the calculation of Phase 2: in Fig. 3 phase 2 is the composite of the periods between the two maxima of rainy seasons with a bimodal pattern (MSD years). For these cases the MSD periods variate from 1 to 3 months. In contrast, in Fig. 4 the calculations were made using monthly (and bimonthly) data for MSD (second column) and non-MSD years (third column). We did so because in the non-MSD there is no bimodal pattern, and therefore there is no way to define the phases as in Fig. 3.
Comment by: Teddy Allen
September 10, 2015 - 2:36pm
Thank you for your reply. I would be very happy to have your comments on my poster. It tries to address the seasonal evolution of the processes that support the onset and cessation of the Caribbean early rain season. I've tried to show that the cessation of the early rain season is the same as the onset of the MSD period. This transition can be shown through weakened uplift dynamics into the Caribbean during the relatively dry mid-summer (and possibly a northward shift to support rainfall along the NACZ during the mid-summer).
"Are you suggesting that a moist atmosphere in thermodynamic equilibrium would have no rain?" No. I am suggesting that there would be LESS rain compared to the same moisture environment with elevated uplift dynamics. This in essence is my explanation for the relatively dry mid-summer: weakened uplift dynamics compared to the late spring / early summer.
cheers!
Not accepting new comments