Spatial Risk of Extreme Hurricane Winds over the Gulf of Mexico and North Atlantic
Jill
Trepanier
Louisiana State University-Geography and Anthropology
Poster
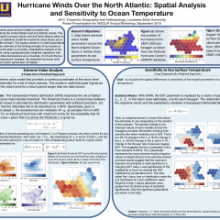
Hurricanes threaten the United States every year. It is important to quantify the risk of these events for emergency managers. Extreme value statistics are used to model hurricane characteristics at different locations. Utilizing a spatial tessellation across the North Atlantic and Gulf of Mexico provides insight into the local risk of hurricane strikes. Parameters from the extreme value model are mapped across space to visualize patterns. Sea surface temperature is included as a covariate in a geographically weighted regression model with each parameter. It is found that as sea surface temperatures increase, the expected hurricane wind speed for a given return period also increases.
Poster 22.pdf
(1.7 MB)
Session III: Weather and climate extremes in the Americas
Number of comments: 11
Comments
Comment by: Suz Tolwinski-Ward
September 2, 2015 - 6:32am
Hi Jill, I don't have experience fitting GPDs, and so lack intuition in the interpretation of some of your results. But I'm curious about the mostly (all?) negative fitted values of the scale parameter across your domain, since you say in the associated Natural Hazards paper that a negative scale parameter leads to an upper limit on the support of the GPD pdf. How sensitive is the inferred upper bound to a choice of any particular subset of your data? I wonder whether a connection can be made between this statistical upper bound and mechanisms-based upper bounds, perhaps for example climatological values of maximum potential intensity (MPI, derived from thermodynamic theory; see eg. http://wind.mit.edu/~emanuel/pcmin/pclat/pclat.html). Just curious if you have any thoughts along these lines. Depending on the sensitivity of your parameter estimates, spatial fields of climatological or maximum-observed MPI might even provide further constraints on your parameter estimates, given the limited length of the available data sets! A second question I had was what your sense is of how the undercount bias in the early part of the HURDAT data affects the inference you've made in this work.
Comment by: Jill Trepanier
September 9, 2015 - 8:22am
Hi Suz! Thanks for the comments and questions. Regarding your question about the negative scale parameter: That upper bound is sensitive to the threshold choice in two ways. The first: if I choose a threshold that is too low and include many storms, the distribution fails to fit an extreme value and the upper bound tends to be far too conservative (meaning, it is too low for what the data suggest - it will provide too low return levels for a specified return period, when, using a strictly empirical model, the return level should be higher. Second, if I choose a threshold that is too high, the model fails to compute and provides me with very low xi levels (below -3) and completely out-of-the-question return levels (100 m/s every 5 years for example). I'm considering writing a paper that quantifies that very thought - how sensitive is the xi parameter to the threshold choice. For this and other papers, I have it set at the 50th percentile so the theory is comparable from grid to grid and I can consider the idea of "relative risk" at each location. But a paper assessing the sensitivity to xi could be very enlightening about this methodology. I do agree that a connection could be made between MPI and this statistical upper bound. Perhaps a limiting mechanism from the MPI could be used as the limiting physical bound on the statistical model. Interesting, and great idea! I think that you and I should explore this idea further for a potential future project! And for your second question, I truly do not believe the model is sensitive to the undercount bias. At least for the locations I have tested. I have run the model for various locations using both the entirety of the data as well as the satellite record (1980 on) and at the locations where I retained enough data to model, it did not present a noticeable bias. If you would like, I can send you my RP paper from JAMC for Florida cities. It has been a little while, but I'm pretty certain I have results in there for Miami for data beginning in 1900 vs. 1980.
Comment by: Suz Tolwinski-Ward
September 11, 2015 - 8:17am
Thanks for the reply, Jill. I actually meant subsetting the data in the more traditional, non-GPD sense of withholding half (or some proportion of years) for validation. On one I imagine that kind of analysis is tricky when you're trying to get at tail behavior and you just halved the amount of data available for even defining what the tail means! But on the other hand you did something like that to check sensitivity to undercount bias in the early record and saw little sensitivity-- which is a really nice feature of this kind of modeling for the hurricane winds problem. I suppose the really big storms with extreme “tail” winds probably weren’t the ones that went uncounted in the early record.
The issue you bring up about sensitivity of return levels to threshold choice definitely seems like a critical one to explore further, given the implied range in return levels you describe. I'm looking forward to the paper you have planned on this! I agree that connecting the statistical upper bound with MPI would make a pretty cool project-- let's be in touch about this!
Comment by: Jill Trepanier
September 11, 2015 - 8:31am
Thanks, Suz. Yes, I see now, you were describing some kind of "block maxima" approach, something more traditional. I've always shied away from that method just due to the limited amount of tail data I have to work with and the known limitations of excluding more than necessary. But it might be worth a test. And yes, you are definitely right (at least in my opinion) about those major storms likely not being undercounted in the earlier part of the record. Those would likely be the only ones noticed! But it is definitely worth trying to find more information about the limitations of the data and the sensitivity of the model. I look forward to more communication on this!
Comment by: Ángel G. Muñoz
September 11, 2015 - 8:39am
Hi Jill, nice poster!
Are you using SSTs for the entire planet or are you considering particular regions/indices? How robust are the results when you change the domain? I think this question is related to Suz's. Thanks
Comment by: Jill Trepanier
September 11, 2015 - 8:47am
Hi Angel! Thank you! SSTs are averages taken from the 2X2 degree grid points in each hexagon from 1854-2010 for the months of August, September, and October. Each hexagon has one SST value related to the latent parameters. By domain, do you mean the size of the hexagons themselves? It didn't make it on to the poster, but some of the work I have done on this dealt with the modifiable areal unit problem and spatial autocorrelation (both in this larger region, as well as focusing on the Gulf coast more specifically). MAUP has never shown to be a problem, though I cannot make the hexagons too small or I'll run out of data to model. I have tried them in multiple sizes and have never been presented with anything that suggests an aggregation bias with the way I have currently done it. The latent variables are autocorrelated (all except the scale parameter) which makes physical sense, since a hurricane passing through multiple grids will have similar intensity values from one grid to the next (autocorrelation decreases the most nearest the coast - again makes physical sense). The xi parameter is not autocorrelated spatially and this is due to the sensitivity to the most extreme events. All of that being said, the results are consistent even if I change the domain size of the hexagons. I hope this answered your question (I tend to ramble - let me know if it needs to have more direction).-Jill
Comment by: Vasu Misra
September 11, 2015 - 12:43pm
Hi Jill,
Nice work. I am naively interpreting your results to be similar to computing maximum potential intensity variations with SST. If that naivety is indeed reasonably okay, then I am wondering if upper ocean heat content would be a better metric than SST as there are a few papers from Taiwan which claim that maximum potential intensity based OHC is far more reasonable than using SST.
Comment by: Jill Trepanier
September 11, 2015 - 12:46pm
Hi Vasu, Thanks for your comment. Yes, that naivety is reasonable, as both are approaches to understanding hurricane limiting intensity. That is a fantastic idea and one I will explore further. I simply have not used OHC as a predictor of the latent variables, but based on these papers you are referring to, it might be the more appropriate choice. I'll make sure to look up the papers. Thank you!
Comment by: Christian Dominguez
September 11, 2015 - 2:33pm
Hi Jill,
Good poster!. By any chance, have you analyzed other environmental variables as humidity, vorticity, wind shear (which seems to be one of the most important factors to intensify TCs over the Caribbean Region) and Ocean Heat Content (OHC)?. The intensifying process could be very complicated to analyze because sometimes a lot of ingredients are interacting at the same time.
Comment by: Jill Trepanier
September 14, 2015 - 9:44am
Hi Christian,
Thank you for your question. I have not assessed those other variables, but you may have noted that one of the other commenters also thought OHC would be a great idea. I appreciate your recommendations and I look forward to incorporating those into my model as I move forward with my research.
Not accepting new comments