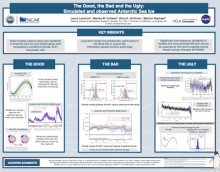
Observed, observationally based estimated, and simulated Antarctic Sea Ice
Laura
Landrum
National Center for Atmospheric Research
Poster
Annually the Antarctic sea ice expands and contracts over an enormous range - gaining and losing roughly 15 million km2 every year. In addition, satellite records of Antarctic sea ice concentrations show small yet significant increases in all seasons from 1979-2016 followed by record lows in 2017, 2022 and again in 2023. The observed trends also vary regionally, with the largest positive 1979-2016 trends in the Ross Sea during the austral fall.
CMIP5 simulations of Antarctic Sea Ice were deemed of “low confidence” in the Intergovernmental Panel on Climate Change AR5 report due to extreme inter-model spread and overall inability of many models to adequately reproduce the mean, variability and trends in Antarctic sea ice seen in the observations (Collins et al., 2013). CMIP6 simulations show only small improvements, and the intermodal spread in the annual mean cycle of Antarctic Sea Ice remains substantial (Roach et al., 2020). Most models do not capture the observed 1979-2016 trends, particularly those in the Ross Sea in the fall. Although the intermodal spread in simulated Antarctic sea ice is substantial, there are nonetheless individual climate models that capture Antarctic sea ice quite well, including seasonal and regional means and variability. One such model is the Community Earth System Model (CESM).
In this presentation we summarize satellite observations, model simulations and extended, observationally-based estimates of Antarctic sea ice trends. We highlight recent experiments using different versions, experiments, and large ensembles of the CESM to explore possible mechanisms underlying mismatches between observations and model simulations.
Poster file
landrum-confronting-poster.pdf
(4.78 MB)