The Seasonality of Surface Temperature Trends in Models and Observations
John
Nielsen-Gammon
Texas A&M University
Poster
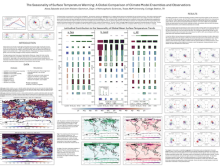
Over the last century, the observed annual Global Mean Surface Temperature (GMST) trend is largest in March, however historical simulations by General Circulation Models (GCMs) peak a few months earlier. This study quantifies the observed seasonal trends at individual grid points, and in the form of zonally averaged latitude bands, using surface air temperature (SAT) data over land and sea surface temperature (SST) for ocean regions for all regions of the globe. Three ensembles of coupled GCMs are compared to observations: the MPI Grand Ensemble and the CMIP5 and CMIP6 multi-model ensembles.
The largest mismatch between models and observations stems from the GCMs’ gross underestimation of the forced seasonal warming trends that occurs over Northern Hemisphere (NH) mid to high latitude regions. This seasonality of warming in the NH, along with a relative maximum of Southern Hemisphere (SH) mid-latitude SST seasonal warming in March, are contributing the most to the observed seasonality in the GMST trends. The seasonality of the GCM’s GMST trends are primarily driven by SST trends and in general the spatial contribution to their global mean trends is more evenly distributed across latitude bands throughout the globe. The spatial pattern and timing of disagreements between observations and models suggest issues with snow and sea ice cover and their effects on surface temperatures.
The largest mismatch between models and observations stems from the GCMs’ gross underestimation of the forced seasonal warming trends that occurs over Northern Hemisphere (NH) mid to high latitude regions. This seasonality of warming in the NH, along with a relative maximum of Southern Hemisphere (SH) mid-latitude SST seasonal warming in March, are contributing the most to the observed seasonality in the GMST trends. The seasonality of the GCM’s GMST trends are primarily driven by SST trends and in general the spatial contribution to their global mean trends is more evenly distributed across latitude bands throughout the globe. The spatial pattern and timing of disagreements between observations and models suggest issues with snow and sea ice cover and their effects on surface temperatures.
Poster file