Detection of recent regional sea surface temperature warming in the Intra-Americas Region, 1982-2012
Equisha
Glenn
The City College of New York (CCNY), NOAA-CREST
Poster
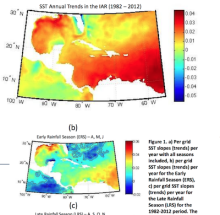
We report a recent sea surface temperature (SST) warming trend occurring in the Intra-Americas Region (IAR) over the 1982 – 2012 period. The IAR, defined as the geographical region that includes the Caribbean, Mexico, Central America and parts of North and South America, is a distinctive region of dynamic climatological phenomena that is particularly sensitive to climate changes. Using an optimum interpolated SST (OISST), 0.25° resolution data product of the National Oceanic Atmospheric Administration (NOAA), a 30-year climatological analysis was generated to observe annual, monthly, and seasonal trends. Results show that SSTs are increasing annually for the region. For the two Caribbean rainy seasons, the Early Rainfall Season (ERS) and the Late Rainfall Season (LRS), estimated trends at 0.0161°C year-1 and 0.0209°C year-1 were observed, with high statistical significance. Sub-regional gridded analysis revealed that warming is greatest in the Gulf of Mexico and North of South America during the ERS and LRS, also with high statistical significance. Additionally, LRS averages for 1998-2012 reflect an increase in magnitude and intensity of the Atlantic Warm Pool (AWP) since the 1983-1997 period reflected in the AWP Area Index. The AWP Area Index, the region with temperatures above the threshold of 28.5°C, shows a clear expansion of close to twice its size over this 1998 – 2012 period. Extreme increases/decreases in time series show potential correlation with El Niño and the Southern Oscillation (ENSO) while in the El Niño (positive) phase.
Poster 4.pdf
(575.61 KB)
Session I: Identifying opportunities and challenges of observing and modeling IAS variability and its teleconnections
Number of comments: 12
Comments
Comment by: Vasu Misra
August 31, 2015 - 1:20pm
Hi Equisha,
What happens to the trends over the IAS when you use longer records say from ERSST or HADISST? How important is daily values of SST for the detection of these linear trends vs resolution in space (0.25 degree vs 1 degree)?
Comment by: Equisha
September 3, 2015 - 3:08pm
Hello Vasu, thank you for reading the poster.
In response to your question:
The reason we used the NOAA OISST product is two-fold. Currently, the OISST product provides the longest data record (starting from 1981) at a resolution of 0.25 degrees. In the future, we do aim to explore the use of other records to analyze longer time periods. If you were to use records from ERSST or HADISST to analyze trends, you should see similar results for the time period I analyzed, 1982 - 2012. However, it is unknown as to how the trend will vary when you use a longer data record. We can only hypothesize that an increasing trend would be observed using SST data sets that overlap a time range similar to the 1982 – 2012 period.
The importance of temporal resolution (e.g. daily data) vs. spatial resolution (e.g. 0.25 vs. 1 degree) actually varies depending on your analysis objective. Because my goal was to generate the 30-year climatology and long term trends for the IAS, it was not crucial to use daily data (vs. monthly data). However, using data with a high spatial resolution (i.e. 0.25 degree) was important because I wanted to observe the patterns of SST warming within the IAS. For example, if the resolution was too coarse then I would not be able to detect the degree of localized SST warming of a small area. At a coarser resolution, I might not have been able to observe the warming occurring near the coast in the Gulf of Mexico.
Comment by: Germán Poveda
September 8, 2015 - 2:03pm
Hi Equisha,
What do you conclude from your results regarding the stated Hypothesis about the role of climate variability and its association with the identified trend? Is the trend a manifestation of climate change and or climate variability? How to disentangle both effects?
Besides, it would be interesting to explore whether the annual IAR SST series shows any association with the intensification of hurricanes over the Caribbean, as quantified by the Power Dissipation Index (PDI), which accounts for cyclone strength, duration, and frequency. The PDI series exhibits a similar kind of trend.
Comment by: Equisha
September 9, 2015 - 12:55pm
Hello German, thank you viewing the poster.
In response to your questions/comments:
From our results, we can see observe how the regional trend follows the global SST trend for the 1982-2012 period. Upon further analysis, the IAR trend follows that of the global trend, regardless of the occurrence of the Atlantic Multidecadal Oscillation (AMO) (not shown). It appears that the global trend is manifesting itself within the IAR during this period. In other words, the data was detrended to eliminate annual variability for regional SSTs and for the ENSO index cross-correlation.
We agree that hurricane activity/intensity for this period should be investigated to determine if there is a correlation with the recently observed warming SST trends in this region. We are very interested in this analysis and this is part of our future work, in addition to examining the precipitation trends and atmospheric variability (Caribbean Low-Level jet, vertical wind shear, trade winds).
Comment by: Teddy Allen
September 8, 2015 - 10:37pm
Equisha,
Nice Poster! I am very interested in learning more about how variability in the general circulation within the IAS affects the spatial variability of SST anomalies. Perhaps understanding trends in low level winds may tell an important story.
Your figure 1 provides strong hints towards the role of the trades in affecting SST variability in the southern Caribbean. Have you calculated the trends in the trade winds in that region? It would be interesting to pinpoint a cause for the strong positive trends in the southern Caribbean region.
Also, do you think the forcing on SST from the CLLJ and from that of the trade-winds are distinct? Munoz et al. 2008 say the CLLJ is the result of a thermal contrast between the high mountain of the northern coast of South America and the overlying marine air while Whyte et al. 2007 say the CLLJ is a manifestation of the trade winds.
I am working at the IRI and would be happy to meet in person to talk more about your work as it is related to my interests in Caribbean rainfall variability. (I assume from your poster that you live in NYC too?)
And finally, what is the spatial domain for your figure 2?
thank you!
teddy
Comment by: Equisha
September 9, 2015 - 1:26pm
Hello Teddy, thank you for viewing the poster. We appreciate your interest.
As part of our future work we will be exploring the variation/trends of the CLLJ and to investigate correlations with the recently observed SST warming in the IAR.
The research is underway, however we do not have the trade winds analysis completed at this time. Preliminary analysis does show increasing trends in the CLLJ in the Northern Caribbean early rainfall season (i.e. Daniel Comarazamy et al. 2013). The SST trend analysis produced interesting results and we are exploring the causes for the observed trends.
This is a vey interesting question. The goal is to investigate hypotheses such as these through the atmospheric analysis. It is quite possible that there is a third scenario, which works more as a feedback and interconnection between both the CLLJ and the trade winds. The connection stems from the North Atlantic Subtropical High.
The spatial domain for Figure 2 is Lat: 5N – 30N, Lon: 100W – 55W.
We would be more than happy to meet you and Prof. Gonzalez can invite you to perhaps give a talk! We are also located in NYC. Feel free to email me at equishaglenn@yahoo.com so we can exchange contact information and set up a meeting.
Regards, Equisha
Comment by: Teddy Allen
September 9, 2015 - 1:36pm
Great! I will be in touch soon via email.
thank you,
teddy
Comment by: Jill Trepanier
September 9, 2015 - 12:50pm
Dear Equisha,
Thank you for your poster! I don't have a question right now, but want to say that I have a student currently working on lightning formation in the Lake Maracaibo Region in northwestern Venezuela and one of her predictors is nearby SST. Your poster has provided some interesting ideas about the changes in nearby SST that she will be able to consider for her theoretical background. Nice work!
Jill
Comment by: Equisha
September 9, 2015 - 1:22pm
Dear Jill, thanks for viewing our poster. Coincidently, one of the motivating factors for the research was in fact the possible consequences in local eco-systems, one reported phenomenon is in regard to the lakes volume increases in Hispaniola that we believe are linked to increased moisture levels due to the warmer SSTs. Please, keep us posted of your work.
Regards, Equisha
Comment by: Jill
September 9, 2015 - 1:26pm
Will do! Thanks!
Comment by: Frank Muller-Karger
September 11, 2015 - 9:09am
Hi -
I was wondering if you are aware of these papers. Perhaps they can be useful:
Chollett, Iliana, Peter J. Mumby, Frank E. Müller-Karger, and Chuanmin Hu. 2012. Physical environments of the Caribbean Sea. Limnology and Oceanography. Limnol. Oceanogr., 57(4), 2012, 1233–1244. doi:10.4319/lo.2012.57.4.1233.
Chollett, Iliana, Frank E Müller-Karger, Scott F Heron, William Skirving, Peter J Mumby. 2012. Seasonal and spatial heterogeneity of recent sea surface temperature trends in the Caribbean Sea and southeast Gulf of Mexico. Marine Pollution Bulletin. http://dx.doi.org/10.1016/j.marpolbul.2012.02.016
Muller-Karger, Frank E., Joseph P. Smith, Sandra Werner, Robert Chen, Mitchell Roffer, Yanyun Liu, Barbara Muhling, David Lindo-Atichati, John Lamkin, Sergio Cerdeira-Estrada, and David B. Enfield. 2015. Natural Variability of Surface Oceanographic Conditions in the Offshore Gulf of Mexico. Progress in Oceanography. 10.1016/j.pocean.2014.12.007.