Extra-tropical Ocean-Atmosphere Interaction
by Young-Oh Kwon
Young-Oh's recent research interests are in the North Pacific decadal variability and the atmospheric response to extra-tropical ocean heat transport variations using climate model simulations.
North Pacific Decadal Variability in the CCSM2
North Pacific decadal oceanic and atmospheric variability is examined from a 650-yr control integration of Community Climate Model version 2 (CCSM2), which exhibit significant spectral peaks at approximately 16 yrs (Kwon and Deser, 2007). The results suggest that the simulated North Pacific decadal variability owes its existence to two-way ocean-atmosphere coupling. Especially, the anomalous geostrophic heat flux divergence in the Kuroshio Extension drives the decadal SST anomalies, which are then damped by the surface heat flux.
Coupled Atmosphere-Ocean Mixed Layer Response to Extra-tropical Ocean Heat Transport Variation
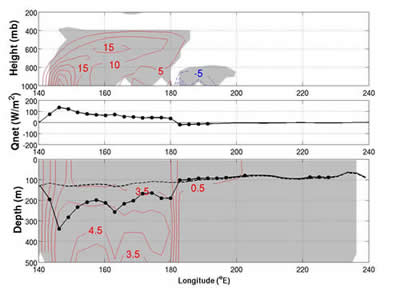
In this study, we investigate the coupled atmosphere-ocean mixed layer response to ocean heat transport in the Kuroshio Extension using the Community Atmospheric Model (CAM) coupled to an array of independent single column multi-layer ocean model with explicit mixed layer physics (Figure 1). The ocean model does not retain any lateral dynamics. Instead, the decadal anomalies of geostrophic ocean heat flux divergence are diagnosed from the CCSM2 control integrations and specified in the ocean model to force the coupled system.

Figure 1. February equilibrium responses along a zonal section averaged for 35-45°N in the North Pacific to the geostrophic ocean heat flux divergence specified in the Kuroshio Extension (35-45°N, 140-180°E). (Top) Diabatic heating response. Contour interval is 5 ´ 10-6 K s-1. Positive (negative) response is plotted with red (blue) contours. Zero contour is supressed. Shadings indicate significance at 95 % level. (Middle) Net surface heat flux response. Positive is from ocean to atmosphere. Dotted valules are significant at 95 % level. (Bottom) Ocean temperature response is plotted with red contours. The contour interval is 1°C and the contours start from 0.5°C. Shadings indicate significance at 95 % level. Dashed black contour is mixed layer depth from the control integration and the solid black contour is mixed layer depth from the perturbation integration. Dotted values are significant at 95 % level.
