The Kuroshio Extension Observatory (KEO) and the Role of Air-Sea Interactions in the Kuroshio Extension
by Meghan Cronin
As PI and director of the Kuroshio Extension Observatory (KEO), Meghan Cronin is interested in understanding the nature and effects of the air-sea heat, moisture, momentum, and carbon dioxide fluxes in the Kuroshio Extension region.

The Kuroshio Extension Observatory, a time series reference site
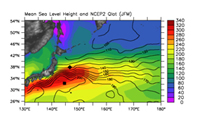
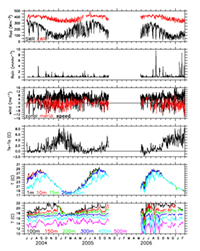
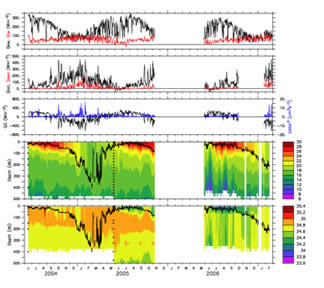
The KEO buoy site at 32.4°N, 144.6°E is in the recirculation gyre south of the Kuroshio Extension (Fig. 1). Funded through NOAA Office of Climate Observations, KEO is an OceanSITES time series reference site. It carries a full suite of sensors to monitor air-sea exchanges of heat, moisture, momentum, and carbon dioxide, as well as upper ocean temperature, salinity, and currents (Fig. 2). KEO was also an element of the now-complete Kuroshio Extension System Study. For more information on KEO, see: http://www.pmel.noaa.gov/keo/.
With funding from JAMSTEC, Dr. Hiroshi Ichikawa and Dr. Cronin recently deployed a second surface mooring, J-KEO, north of the Kuroshio Extension, at 37.9°N, 146.6°E (Fig. 1). Ichikawa and Cronin are respectively the Japanese and U.S. partners on the proposed "Study of the temporal spatial variations of ocean surface fluxes in the North Pacific using the surface mooring network".

The Role of Air-Sea Interactions in the Kuroshio Extension
Cronin is presently involved in several analyses that address:
- What is the magnitude and variability of the air-sea fluxes in the Kuroshio Extension (KE) region? How well are these represented in satellite products and numerical weather prediction model forecasts and reanalyses?
- What processes give rise to anomalous air-sea fluxes?
- What processes control the SST and heat content variations on intraseasonal-to-interannual time scales? What controls Subtropical Mode Water formation?
- How do SST, heat content, and KE frontal variations affect storm development, clouds, and storm path? Are these effects enough to significantly influence the atmospheric circulation?

