Analysis of Superficial Sea Temperature Anomalies in Colombia Basin– Caribbean Sea
Angela
Rodríguez
Universidad Nacional de Colombia, Grupo de investigación CENIT
Poster
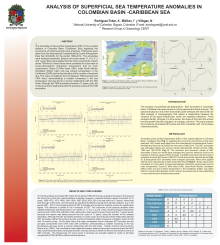
The anomalies of sea surface temperature (SST) in four coastal stations in Colombia Basin (Caribbean Sea) regarding the occurrence of extreme events were analyzed. TSM series were taken from the International Comprehensive Ocean-Atmosphere Data Set (ICOADS) for the period 1960-2014. The TSM anomalies was calculated taking into account values standardized climatic periods 1960-1990 and 1981-2010. The minimum and maximum values of semi SST anomalies which were averaged, these maximum and minimum values were used as reference limit for the selection of the lengths to analyze events were extracted. Subsequently SST anomalies were analyzed spectrally, being in all cycles series 11, 6.5, 4, 2 and 1 year, filters were applied and the main components of each series TSM found, these values were correlated so cross-rates of ocean-atmosphere interaction phenomena and its main components: Ocean El Niño Index (ONI), index North Atlantic Oscillation (NAO) index and sea surface temperature in the Caribbean (CAR), was taken further in account the deviation of the number of sunspots due to the outstanding 11-year cycle found in all observation points. The major correlations found it between the maximum and a minimum TSM anomaly were CAR index, demonstrating a notable increasing in the sea temperature and was found a inverse relationship with the ONI index. Although the TSM anomalies showed a 11 years cycle, did not found a direct relationship with the extreme events of the TSM anomalies.
KEYWORDS: Caribbean sea, Superficial sea temperature anomalies, Ocean Niño index, North Atlantic Oscillation index, surface temperature in the Caribbean index.
KEYWORDS: Caribbean sea, Superficial sea temperature anomalies, Ocean Niño index, North Atlantic Oscillation index, surface temperature in the Caribbean index.
Poster 6.pdf
(988 KB)
Session III: Weather and climate extremes in the Americas
Number of comments: 6
Comments
Comment by: Teddy Allen
September 6, 2015 - 3:32pm
Is the major conclusion that a positive trend in SST anomalies exists in all four stations during the 21st century?
And is SST variability within these 4 stations related to the sunspot cycle (11yrs), ENSO (4-6 years), and extreme events? I may have missed the part in your poster about the extreme event related variability.
What is it about ENSO that you think forces the SST variability? How do you think changes in the CLLJ affect SST variability at this latitude?
Thanks!
Comment by: Angela Rodríguez
September 8, 2015 - 8:35pm
Hi Teddy,
Thank you for your comments. These are the first results of our study, so we could see that the trends varies in each period, but the last fourteen years in clearly positive, actually, in the last period we can observe in all stations analyzed that the extreme anomalies of SST were more frecuently and their ranges were majors compared with the rest of period.
Related with the 11 years cycle found in all series, we have found that, although the signal has high spectral power, our reciently calculations we have not seen a big correlation between the sunspot cycles and the 11 yr component of SST. The best correlation found until now, has been between ONI and SST anomalies, specially with the 5-4 years component, in Punta Gallinas and Providencia stations.
On the other hand, you are right about you are missed with the results about extreme events, we don't have final results yet, but we have seen that no all the ENSO extreme episodes have influence over the major SST anomalies.
Finally, many studies have demostrated the influence of the CLLJ over SST in our region, specially over the Guajira Peninsula, close Punta Gallinas Station, where the CLLJ influences upwelling processes. About your cuestion, we think that changes in the CLLJ definitely affects the SST behaviour, taking account that the CLLJ is a cusi-permanent fenomena that modulates oceanographic characteristics and processes in our region.
Comment by: Germán Poveda
September 8, 2015 - 1:12pm
1) How did you test for significance of the identified trends?
2) It would be very beneficial if you show lagged correlation results among diverse indices and SSTs in the studied stations. Does the correlation with ENSO (ONI) reach maximum value associated with a certain lag? Same question for NAO, CAR and suspots?
3) Please improve discussions of your results and try to link with the physics to contribute to further our understanding of the climate dynamics of the region.
Comment by: Anonymous
September 9, 2015 - 1:06pm
Dear Dr. Poveda
Thanks for your comments. We can say that the correlations between initial series (SST anomalies and NAO, CAR, ONI and sunspot) were not significative in all stations, the major correlation found it was with the CAR between 0.24 and 0.39 in the Providencia station whitout lags in the other cases with 1- 5 lags. The correlations between main components of SST anomalies and index were found better, special with the 3-2 years component of ONI and his corresponding SST anomaly component, although we saw the highest spectral power in 11 years cycle, we did not find significative values of correlation, in general the correlations index were around 0.30 and 0.46, the last one in Providencia station, the menor value in Rosario station.
In the case of NAO we did not find any correlation, but we are review the posibility to use not the NAO index but use a derived NAO indez relationship with the SST like is used in some studies to Scandinavia and Middle East.
Comment by: Lakshmi Krishna...
September 10, 2015 - 9:08am
Caribbean SSTs and rainfall are shown to be related to NAO. But looks like your analysis doesn't indicate a relationship between SST and NAO. Do you have any insights on why that is the case?
Comment by: Angela Rodríguez
September 10, 2015 - 12:08pm
Hello Dear Khrishna
We did not find any significative corrrelation between SST and NAO, now we have review some papers where the same thing occur when you do direct correlations with the NAO index, but some studies found that is better use a standarize 3-months mean index.
We now are doing new analyses because we waited a major correlaction with this oscillation.
Thank you.