The MJO, Atmospheric Angular Momentum and the Length-of-Day
by Klaus Seickmann
Introduction
The MJO’s most obvious and coherent manifestation is a modulation of convection over the equatorial oceanic warm pool of the eastern hemisphere (~40-180E). These anomalies in tropical convection have a large asymmetric component with an episode of suppressed conditions followed by a period of enhanced convection. Global-scale circulation anomalies in the tropics and subtropics accompany the mature convection anomalies and both move eastward. The manner by which the circulation and convection interact and equilibrate to give the structures seen in composite studies remains mysterious and is a subject of continued research. A further remarkable observation about the circulation anomalies is their relatively large zonal mean or wavenumber 0 component. By the time the active convection reaches the west Pacific a super-rotation of the equatorial atmosphere can develop due to strong westerly wind anomalies in the upper troposphere. Regionally, these anomalies extend from the equatorial date throughout the western hemisphere and back into the Indian Ocean. The anomalies are sufficiently large and broad that they impact the global atmospheric angular momentum (AAM) and the length of day (LOD) or rotation speed of the solid earth.
AAM and LOD during 1996-97
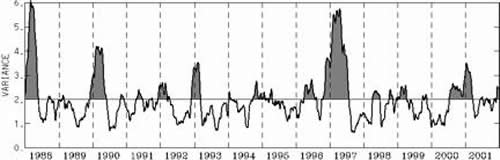
Fig. 1 illustrates this behavior during the series of strong MJOs that accompanied the onset of the 1997-98 El Nino. The bottom curve shows four peaks in AAM during ~January 1 to August 1, 1997 with an average recurrence interval of 60-70 days. Fig. 2 confirms that this period corresponds to a large peak in MJO activity as measured by an index devised by Wheeler and Hendon (2005). The rapid transition to positive values of the Fig. 1 AAM anomaly curve in early March 1997 represents the development of a persistent response to the positive sea surface temperature anomalies present already near the dateline prior to the 1997-98 El Nino. As the event develops further MJO activity weakens and is mostly absent during the 1997-98 winter as seen in Fig. 2.
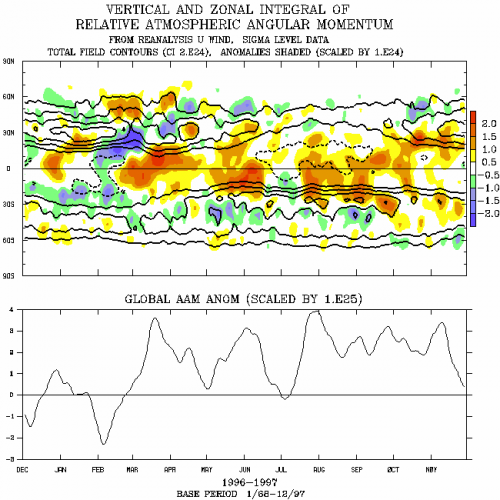
The top panel in Fig. 1 shows the zonal integral of AAM and AAM anomalies. The latter illustrates the quasi-oscillatory tropical zonal wind anomalies that accompany the MJO as well as a tendency for these anomalies to move poleward into the subtropics and mid-latitudes, especially early in the period. The poleward movement is a well-known feature of the MJO that has been studied by Weickmann et al., 1997. Global AAM anomalies tend to be largest as the equatorial zonal wind anomalies move poleward into the tropics of both hemispheres. An astonishing result first reported for the MJO by Langley et al. (1981) is the close correspondence between variations in total global AAM and LOD, two quantities derived using completely independent measurement techniques (e.g. see Rosen, 1993). Fig. 3 compares their daily mean time series for the same period shown in Fig. 1 and illustrates their in-phase behavior. As the atmosphere speeds up, the earth rotates more slowly thereby increasing the length of day (and vice versa). The typical change in LOD related to the MJO is ~0.2-0.4 milliseconds.
MJO and Torques
Frictional and mountain torques induced by the MJO circulation anomalies are responsible for the angular momentum exchange between the atmosphere and the solid earth. Positive frictional torques start the upward trend in AAM when convection increases over the central Indian Ocean (Madden, 1988). As convection moves to the west Pacific, positive mountain torques from east Asian and South American topography provide for a continued increase in AAM. AAM reaches a maximum as convection weakens near the dateline. The relative roles of a direct forcing by the convection versus eddy transport processes induced by the convection remain to be determined. Real time monitoring of the zonal and global AAM budget provides a convenient monitoring and diagnostic tool of the MJO.
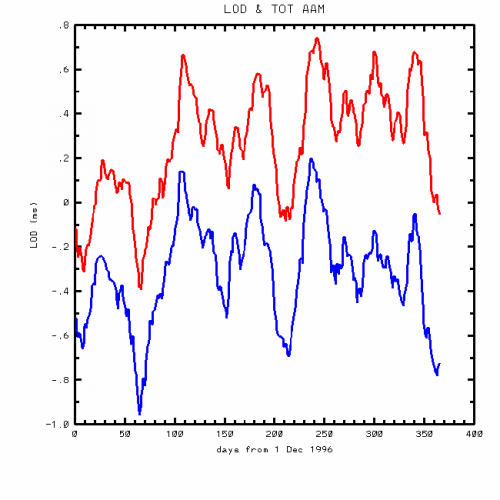
Figure 3. Anomalies in length of day (blue) and total global atmospheric angular momentum (red) for the period 1 December 1996 to 30 November 1997. A conversion from AAM units to LOD units (Rosen, 1993) was applied to the red curve.
References:
Langley, R.B., R.W. King, I. I. Shapiro, R.D. Rosen, and D.A. Salstein, 1981: Atmospheric angular momentum and the length of day: A common fluctuation with a period near 50 days. Nature, 294, 730-732.
Madden, R.A., 1988: Large intraseasonal variations in wind stress over the tropical Pacific. J. Geophys. Res., 93, 5333-5340.
Rosen, R.D., 1993: The axial momentum balance of earth and its fluid envelope. Surveys in Geophysics, 14, 1-29.
Wheeler, M.C. and H.H. Hendon, 2004: An all-season real-time multivariate MJO index: Development of an index for monitoring and prediction. Mon. Wea. Rev., 132, 1917-1932.
Weickmann, K.M., G.N. Kiladis and P.D. Sardeshmukh, 1997: The dynamics of intraseasonal atmospheric angular momentum oscillations. J. Atmos. Sci., 54, 1445-1461.