A global look at the consistency of atmospheric river seasonality
Atmospheric rivers (ARs) play a central role in transporting water vapor from lower to higher latitudes, supplying critical rainfall and snowfall to many regions. Like all major water sources, both excess and deficit can lead to damaging impacts, ranging from drought to severe flooding. A natural question for communities and water managers is: When and where do atmospheric rivers occur most reliably? Seasons offer an intuitive framework, yet the long-held assumption that ARs universally peak in winter has increasingly proven to be oversimplified.
This study provides the first systematic global assessment of how consistently different regions experience a dominant season of AR activity. Rather than focusing solely on the average seasonal peak, it quantifies how often that peak repeats from year-to-year and captures the stability or variability of AR seasonality across regions and across AR detection algorithms.
The results reveal distinct types of regional behavior based on the consistency scale used in this study. The consistency scale is a simple metric derived from directional statistics that accounts for the circular nature of seasons and indicates how reliably each region reaches its peak AR season from year to year. Some regions, such as East Asia, show a strong and dependable peak that recurs almost every year. Others, such as the British Columbia coast, exhibit a generally consistent season but include occasional outlier years. A third group, including the South Atlantic and parts of Australia, shows no clear dominant season, with peak AR timing shifting substantially from year to year.
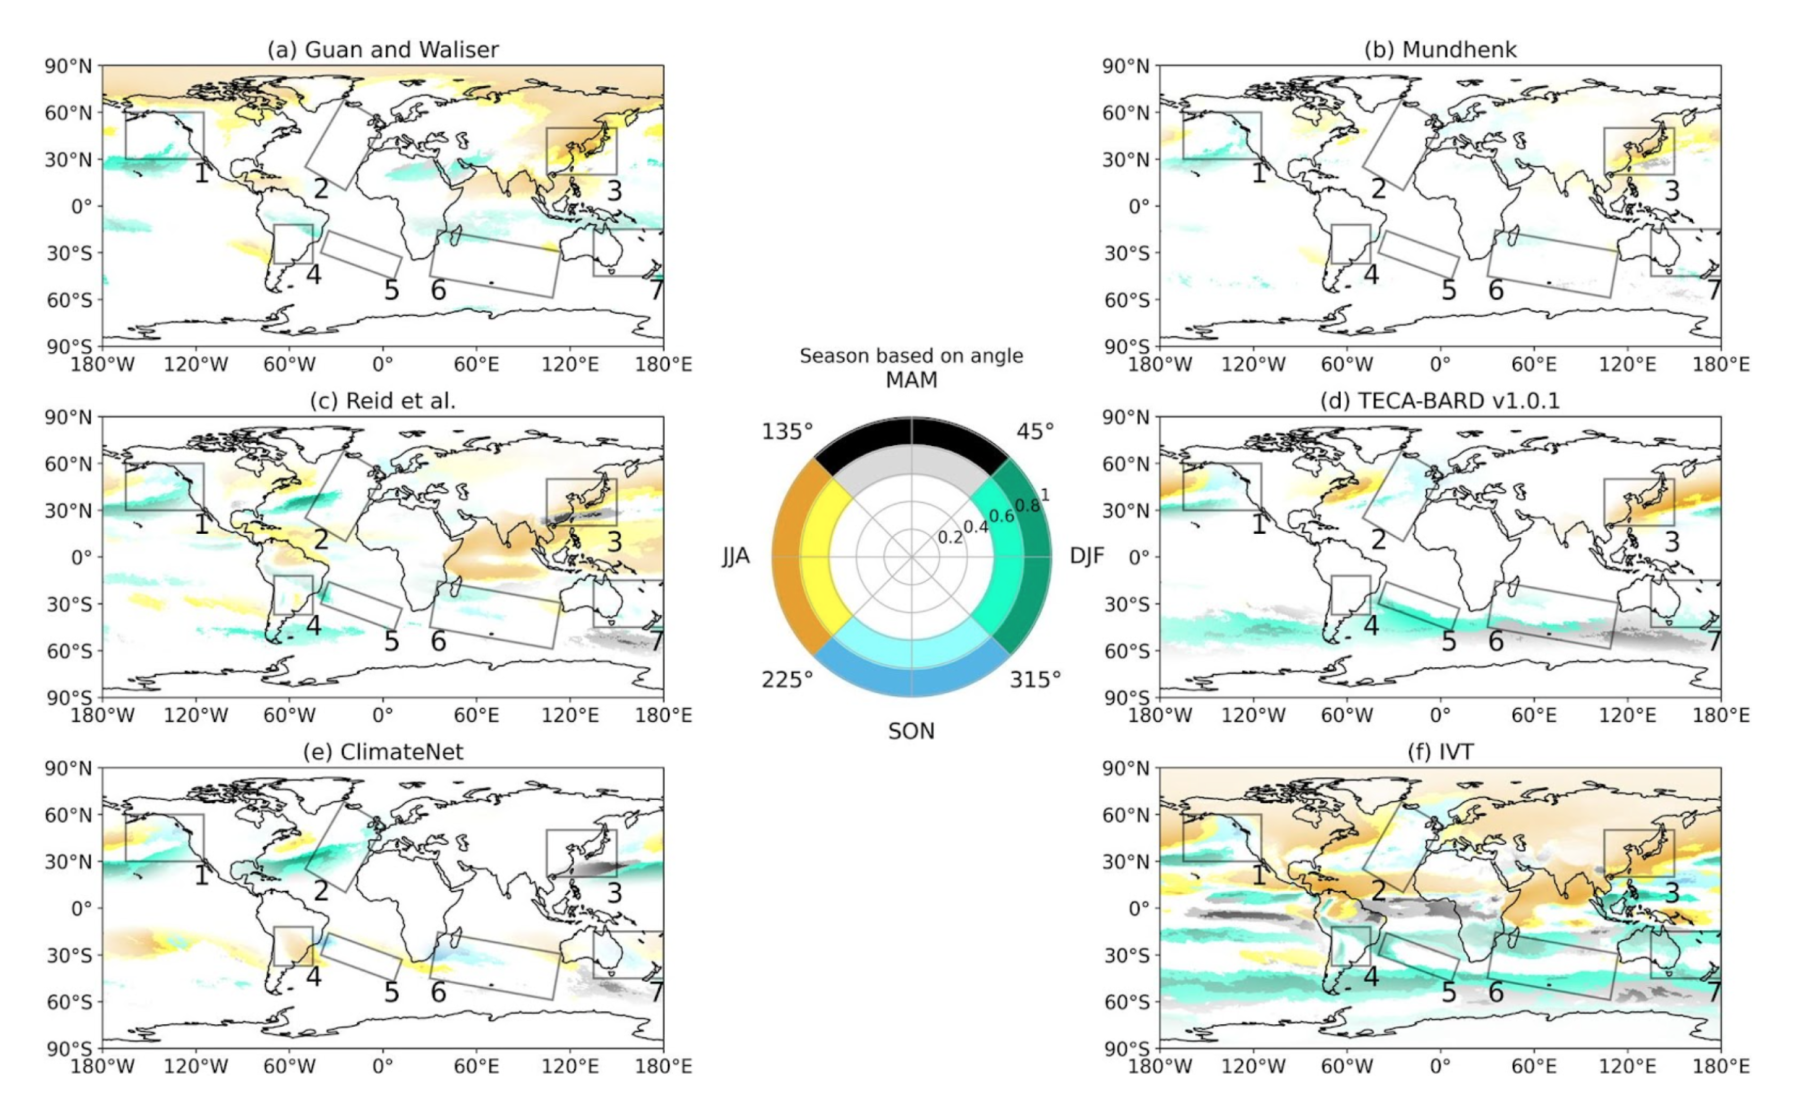
Spatial distribution of the season in which atmospheric river (AR) frequency peaks for consistent (0.6–0.8) and highly consistent regions (0.8–1) across different detection algorithms and integrated vapor transport (IVT) from 1981 to 2016. The color scale in the center features two concentric color wheels: the outer wheel represents highly consistent regions with consistency scale values of 0.8–1, and the inner wheel represents consistent regions with values of 0.6–0.8. This color scale is applied uniformly across all algorithms shown in the figure. Boxes highlight regions of interest for ease of comparison. Opacity in each plot represents the algorithm-specific mean frequency of ARs (or IVT) at each grid point, with pure white indicating regions with either consistency below 0.6 or no AR activity.
These findings reshape our understanding of AR seasonality and emphasize the importance of regional context. The study also examines how different AR detection algorithms influence the identified peak season and highlights where methods consistently agree or diverge. To understand why certain regions lack a repeatable seasonal cycle, the authors further analyze large-scale moisture transport using two diagnostic variables: Integrated Vapor Transport, which tracks horizontal moisture movement, and Moist Wave Activity, which captures moisture intrusions from lower to higher latitudes.
Together, these analyses show that inconsistencies in AR seasonality arise not only from differences among AR detection methods but also from true variability in atmospheric moisture transport. These insights provide a clearer path toward improved water-resource planning and hazard preparedness.
Kamnani, D., T. A. O’Brien, S. Smith, P. W. Staten, and C. Shields, 2025: Regional and temporal variability of atmospheric river seasonality: Influences of detection algorithms and moisture transport dynamics. J. Geophys. Res.: Atmos., 130, https://doi.org/10.1029/2024JD043032.
Topics
- Extreme Events
- Water Cycle