Comparing projections of multiple fire weather indices across the contiguous United States
Climate change is impacting wildfires in the contiguous United States (CONUS), changing their frequency, intensity, and timing throughout the year. Long-term decision-making surrounding wildfire management under climate change could be informed by projections of fire weather. Conducive fire weather conditions are characterized by low moisture, high temperature, and wind. Fire practitioners use indices that synthesize these conditions for decision-making, but differences in methodologies, intended applications, and meteorological inputs contribute to the indices responding differently to climate change. Kessenich et al. (2025) examines changes in projected fire weather for, and compares the responses of, multiple fire indices across CONUS. The analysis is performed using 13 dynamically downscaled regional climate models from North America CORDEX (na-cordex.org). The number of days exceeding relevant historical fire index percentile thresholds are counted, and the differences between a historical reference period (1980–2010) and mid-century (2030–2060) and end-of-century (2069–2099) periods are compared.
By mid-century, many regions project increases in conducive fire weather across multiple indices (figure below). Areas where the indices agree include the Southern Great Plains, the Pacific Northwest, and Northern California. By the end of the century, most of CONUS experiences statistically significant increases in conducive fire weather days. However, the magnitude of change and regions of ensemble agreement vary between indices. These variations reflect the indices’ ability to capture complex interactions between inputs. For instance, the projected higher temperatures lend to conducive fire weather, while increases in future precipitation dampen fire weather. Fire indices that overwhelmingly respond to temperature, like the Keetch Byram Drought Index (panel c), indicate extreme increases in conducive fire weather days, while Energy Release Component (panels d and e) and Burning Index (panels g and h) are more sensitive to precipitation and show less extreme changes and areas of disagreement on future change in conducive fire weather days.
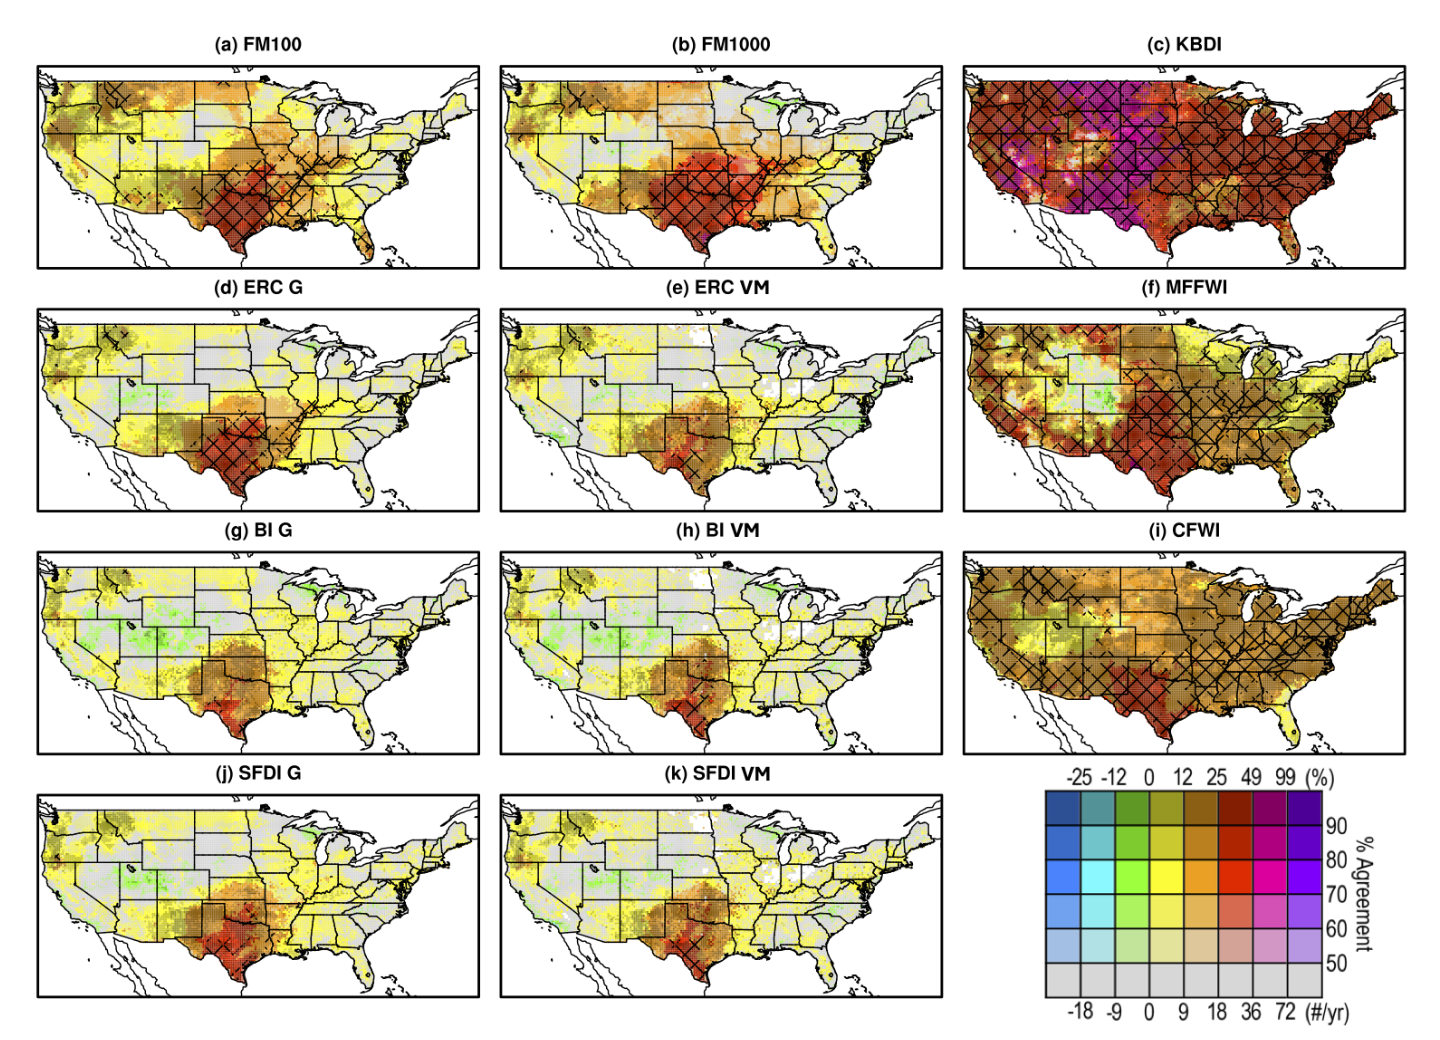
Change in the annual average number of days above the 80th percentile threshold (below the 20th percentile for FM100 and FM1000) from the baseline period (1980–2010) to mid-century (2030–2060). Hatching indicates where the number of simulations projecting a statistically significant change is greater than or equal to 50% of the ensemble and the number of models agreeing on the sign of change is greater than or equal to 70%. Color indicates that at least half the models agree on the sign of change; areas of disagreement are shaded in gray. The intensity of the color, the colorbar y-axis, indicates the level of agreement in the ensemble. In the reference period, 73 days are spent above the 80th percentile. The final number of simulations needed for a given range of ensemble agreement is as follows: 90–100%, 12–13; 80–89%, 11; 70–79%, 10; 60–69%, 9; 50–59%, 8; less than 50%, 0–7. © American Meteorological Society. Used with permission.
The projections of future high fire weather danger days also spread into the shoulder seasons in some regions, either starting earlier or ending later in the year, while other regions show an intensifying season where longer stretches of high fire weather danger persist during established seasons.
These results indicate that the selection of fire indices is highly impactful and that the comparison of multiple fire indices can be informative. The projected increases in conducive fire weather could place greater demands upon fire management resources, pose elevated hazards for populations exposed to fire, and potentially disrupt landscapes and infrastructure more frequently.
Kessenich, L., M. Bukovsky, R. McCrary, S. McGinnis, L. O. Mearns, J. T. Abatzoglou, and A. Cullen, 2025: Multiple fire index examination of future climate change affecting wildfire seasonality and extremes in the contiguous United States. J.Appl.Meteor.Climatol., 64, 1851–1866, https://doi.org/10.1175/JAMC-D-24-0230.1.
Topics
- Climate Change
- Extreme Events
- Modeling