Mapping the surface wave field in two dimensions: New insights from SWOT
The exchange of energy, momentum, heat, and gases between the atmosphere and ocean is impacted by ocean surface waves. While theories describing how ocean currents modulate waves date back to the 1960s, most operational wave models still produce relatively smooth wave fields that vary only at large spatial scales (O 100 km). Numerical modeling studies, however, have long suggested that the wave field is highly variable, presenting strong spatial gradients at scales smaller than 100 km, similar to those of horizontal current variability. Observing this small-scale variability globally has been challenging because traditional satellite altimeters provided only along-track (1D) measurements at coarse spatial resolution.
The recent launch of the Surface Water and Ocean Topography (SWOT) satellite mission has transformed this observational landscape. Villas Bôas, Marechal, and Bohé (2025) leverage data from SWOT’s Ka-band Radar Interferometer (KaRIn) to explore the first-ever two-dimensional (2D) maps of significant wave height (Hs) at kilometer-scale resolution. These novel observations enable detailed investigation of how waves, winds, and currents interact across a wide range of scales and ocean conditions.
The study reveals striking spatial variability in Hs across diverse dynamical regimes, from western boundary currents and regions of mesoscale turbulence to tropical cyclones and long, organized swells.
In particular, the research provides observational evidence that wave–current interactions—primarily through refraction—dominate Hs gradients at meso- to submesoscales. For example, in the Gulf Stream (Figure 1), refraction by strong currents leads to localized convergence of wave energy and enhanced Hs. In the California Current System, SWOT reveals for the first time highly anisotropic, streak-like features in Hs aligned with the direction of wave propagation—confirming the theoretical predictions of wave responses to turbulent vorticity from Wang et al., 2025.
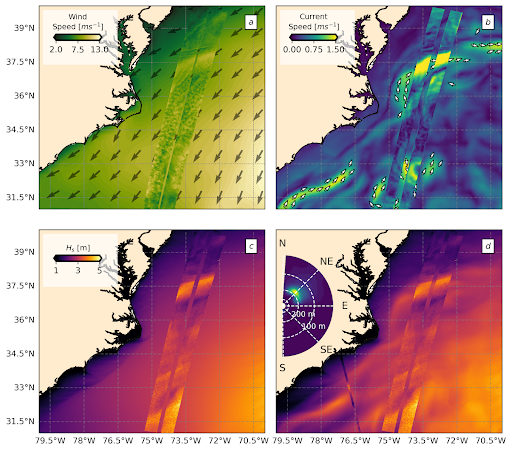
Figure 1. Wind, currents, and wave conditions in the Gulf Stream region during a SWOT pass on 2023-09-02 at 04:13 UTC. Panel (a) shows the wind speed and direction from the ERA-5 reanalysis. Wind speed from SWOT is overlaid. Panel (b) shows the current speed and direction (only for currents faster than 0.7 m/s) from the HYCOM model. Geostrophic currents computed from SWOT's SSH observations are overlaid. Panels (c) and (d) show WW3 Hs snapshots from simulations performed without (CTRL) and with (CURR) current forcing, respectively. Hs from SWOT is overlayed on (c) and (d). CFOSAT nadir observations of Hs (thin line) and directional wave spectrum (inset) are shown on panel (d).
These results demonstrate that SWOT’s two-dimensional view of the ocean surface can bridge a long-standing observational gap in understanding how waves, winds, and currents interact. Such observations are essential for advancing next-generation coupled atmosphere–ocean models and for deepening our understanding of how sea-state gradients influence weather and climate. As SWOT data become increasingly available, they promise to serve as a foundation for community efforts to better represent air–sea interactions in both research and operational contexts.
Villas Bôas, A. B., G. Marechal, and A. Bohé, 2025: Observing interactions between waves, winds, and currents from SWOT. Geophys. Res. Lett., 52, e2024GL114331, https://doi.org/10.1029/2024GL114331.
Topics
- Process Study
- Air-Sea
- Observing Systems