The MJO and the Australian Monsoon
by Matt Wheeler
Could MJO Predictions help for forecasting the Australian monsoon?
Motivation
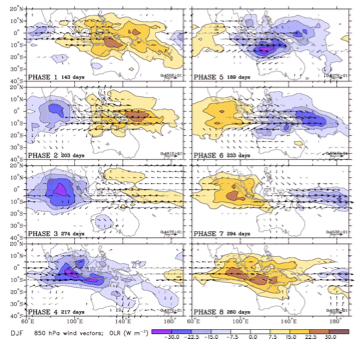
The MJO is typically at its strongest and most coherent during the southern hemisphere summer. During this season, the MJO displays greatest variability of low-level winds and convection across the eastern Indian Ocean and western Pacific between the equator and about 15°S (e.g., Fig.1). This region encompasses the Australian and related Indonesian summer monsoons. Thus great potential for MJO-induced variability of these monsoon systems exists.
Research Summary
The climatological peak of the Australian monsoon occurs in January and February, while monsoon onset typically occurs around mid to late December. Considerable intraseasonal variability of the monsoon rainfall and circulation occurs with each monsoon season being composed of a number of “bursts” and “breaks”, each lasting from a few days to a week or more. A greater portion of this variability can be ascribed to the MJO than to any other intraseasonal mode. During years of strong MJO variability, a large-scale envelope of convection sweeps eastward across the region every 30-90 days, together with changes in low-level winds from easterly to westerly (Fig.1). The precipitation variation associated with a typical MJO event has amplitude of up to 6 mm/day in the far northern coastal region (Fig.2, Phases 5 and 6 versus Phase 2), which is comparable to the standard deviation of weekly rainfall.
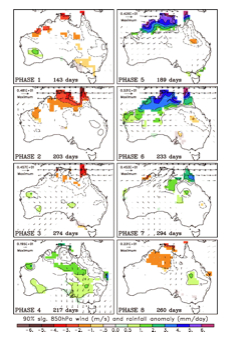
Figure 2. As in Fig.1, except for composites of rainfall and wind over Australia. The precipitation contour interval is 1 mm/day, with additional contours drawn at +-0.5 mm/day. Only those rainfall anomalies that are statistically significant at the 90% level are shaded. Sourced from http://www.bom.gov.au/bmrc/clfor/cfstaff/matw/maproom/RMM/index.htm.
The MJO modulates the large-scale conditions associated with onset of the Australian monsoon, but it does not set the exact date of onset. For instance, at Darwin (12.5°S, 130.9°E) onset rarely occurs during the convectively suppressed phases of the MJO (Phases 8, 1, 2, and 3; Fig. 3), while onset tends to occur in a wide range of the convectively active phases of the MJO (Phases 4, 5, 6, and 7). Thus, while the MJO appears to act as a modulator of the large-scale conditions associated with onset of the monsoon, onset in a particular year is set by a smaller scale event such as a tropical cyclone or passage of a midlatitude synoptic-scale trough embedded in the larger-scale envelope.
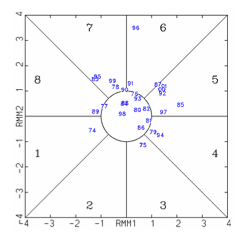
Figure 3. Darwin onset dates (as defined by Drosdowsky, 1996) in the MJO phase space of Wheeler and Hendon (2004). The numbers 1 through 8 (large and black) have the same meaning as the Phases of Figs. 1 and 2. RMM1 and RMM2 are the projection coefficients of the leading pair of empirical orthogonal functions of near-equatorial convection and winds, as are used to define the MJO phases. A blue number is plotted for each monsoon onset, being the year of the nearest December. For example, at the onset of the 1996/97 monsoon, the MJO was in Phase 6 (near the top of figure).
Implications
The robust impact of the MJO on the Australian monsoon, together with demonstrated predictability of the MJO at lead times approaching ~3 weeks, implies the possibility of useful monsoon predictions (e.g., onset date or periods of above normal and below normal rainfall accumulation) at these lead times.
Future Work
In the short-term, extended range prediction of the large-scale dynamical fields associated with the MJO needs to be translated into predictions of parameters of direct relevance to agriculture and hydrology. In the long-term, improvements in the representation of the MJO in dynamical forecast models should allow for prediction of the full range of MJO-related monsoon variability.
Further Reading
Drosdowsky, W., 1996: Variability of the Australian summer monsoon at Darwin: 1957-1992. J. Climate, 9, 85-96.
Hendon, H.H. and B. Liebmann, 1990b: The intraseasonal (30-50 day) oscillation of the Australian summer monsoon. J. Atmos. Sci., 47, 2909-2923.
Wheeler, M.C. and H.H. Hendon, 2004: An all-season real-time multivariate MJO index: Development of an index for monitoring and prediction. Mon. Wea. Rev., 132, 1917-1932.