AMOC observations reveal coherent changes
The Atlantic Meridional Overturning Circulation (AMOC) is a large-scale flow pattern that redistributes heat northward, with implications for global climate. Its strength has been monitored by several mooring arrays since the early 2000s. The expectation has been that these separate arrays would ultimately reveal a correlated signal, indicating coherent changes in the AMOC strength across multiple latitudes. These signals would be masked by local circulation patterns but were expected to emerge on timescales of several years to decades. Over the past decade of measurements, however, the reported tendencies in AMOC strength have differed between two mooring arrays at 16°N and 26°N. In a new paper in the Journal of Geophysical Research-Oceans, scientists have investigated the differences between the arrays and found that both datasets show deep waters (below 1100 m) at the western boundary becoming fresher and less dense. The largest shift occurred in 2009–2010 and earlier at 26°N than at 16°N. In the absence of a similar density change on the eastern side of the Atlantic, this mid-depth reduction in water density at the west would drive transport differences between the upper and lower layers of North Atlantic Deep Water of about 2.6-3.9 Sverdrups (million cubic meters per second). These transport anomalies result in an intensifying tendency in the AMOC estimate at 16°N. But at 26°N, the AMOC has an opposing (reducing) tendency, resulting from the method of correcting the geostrophic reference level. The results indicate that both arrays are observing coherent, low-frequency changes, but there remain discrepancies in the methods of addressing the geostrophic reference level for boundary arrays measuring ocean circulation. Both arrays will need further evaluation of their methodologies, but it is also possible that the ocean circulation is more complicated and just behaves differently than expected. The authors hope that independent measurements, such as satellite gravimetry and numerical simulations, will eventually help to reconcile the observed differences.
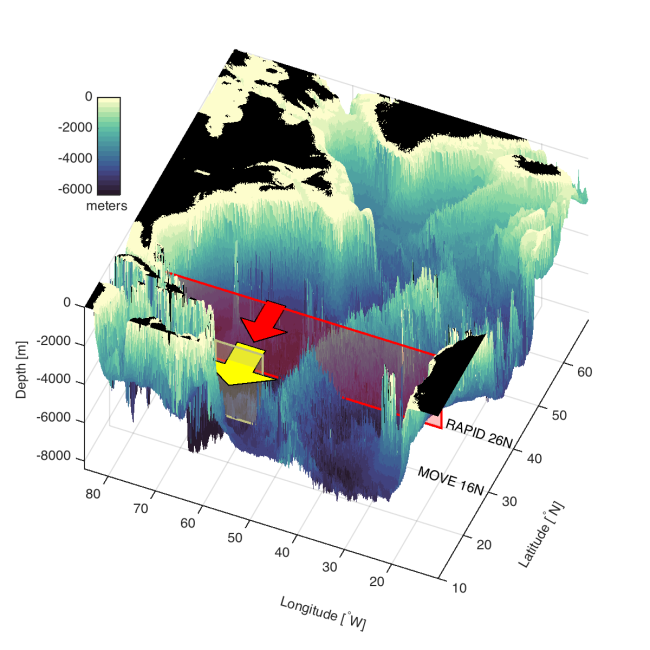
Coherent Circulation Changes in the Deep North Atlantic From 16°N and 26°N Transport Arrays (J. Geophysical Research-Oceans)
1University of Southampton
2Scripps Institution of Oceanography
Topics
- Ocean Heat
- Atlantic Ocean
- AMOC