The anatomy of the long-term mean AMOC at northern high latitudes
The Atlantic Meridional Overturning Circulation (AMOC) is a key player in climate. However, directly observed long-term mean AMOC state over the past several decades is not available to serve as a reference for historical and future AMOC changes. Whether the current or future observed AMOC is different from its long-term mean state remains a challenge. Many climate models simulate a dominant contribution of Labrador Sea deep convection to the AMOC, but this has been challenged by observational analyses, e. g. the recent observations from the Overturning in the Subpolar North Atlantic Program (OSNAP). Traditionally the Greenland Sea is viewed as the northern terminus of the modern AMOC. Climate models often project a substantial future AMOC weakening due to the shutdown of open-ocean deep convection in the Labrador Sea and the Greenland Sea. However, without an observational-based estimate of the long-term mean AMOC to calibrate the mean AMOC structure in climate models, it is difficult to know whether model-simulated historical and future AMOC changes are reliable.
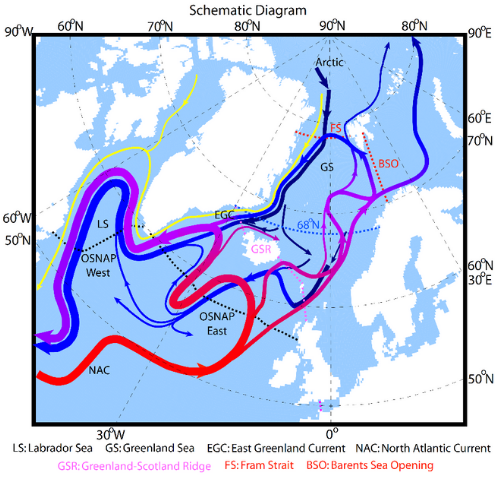
Schematic of long-term mean AMOC pathways overlapped with sections (dotted lines). Colors of arrows indicate seawater density (light to dense: yellow-red-purple-violet-blue-dark blue). The density of Atlantic inflow increases along the pathways of the northeastern subpolar gyre, the gyre extended into Nordic Seas, and the branches entering the Arctic through Barents Sea Opening (BSO) and east Fram Strait (FS). Dark blue arrows: dense outflow through the Nordic Seas. The overflows become lighter after passing through the Denmark Strait and the Faroe Bank Channel due to entrainments. Yellow arrows: light (cold fresh) surface currents. In addition to the non-Ekman depth-space AMOC component linked to the density contrast across a section, the northeastern subpolar gyre and the gyre extended into the Nordic Seas moving with changing densities also contribute to the density-space AMOC. The density contrast across OSNAP East is much larger than that across OSNAP West, sustaining a much stronger AMOC across OSNAP East.
In a recent study authored by Zhang and Thomas, a Robust Diagnostic Calculations (RDC) experiment conducted using a high-resolution global coupled climate model and constrained by observed hydrographic climatology, revealed a holistic picture of the long-term mean AMOC at northern high latitudes over the past several decades. The results suggest that
- The deep AMOC branch across the Fram Strait and the Barents Sea Opening (i.e. the Arctic outflow) provides the densest source water to the mean AMOC.
- The Arctic Ocean, not the Greenland Sea, is the northern terminus of the mean AMOC.
- Open-ocean deep convection, in either the Labrador Sea or the Greenland Sea, contributes minimally to the mean AMOC.
- Horizontal circulation across sloping density surfaces contributes substantially to the mean northeastern subpolar AMOC.
Results of this study suggested that it is important for climate models to simulate a faithful long-term mean AMOC structure for accurate projections of future AMOC changes. The RDC-estimated long-term mean AMOC structure over the extratropical North Atlantic and the Arctic Mediterranean could be valuable for interpreting future observed AMOC changes, guiding modeling and observational efforts, and calibrate AMOC mean state in climate models.
Horizontal circulation across density surfaces contributes substantially to the long-term mean northern Atlantic Meridional Overturning Circulation (Communications Earth & Environment)
Topics
- Observing Systems
- Modeling
- Atlantic Ocean
- Arctic
- AMOC