California winter precipitation linked to the Arctic Oscillation
Winter precipitation in California is largely caused by storm systems as part of the mid-latitude storm tracks that propagate from the Pacific Ocean to the US West Coast. These storm systems tend to be modulated by various factors including the El Niño/La Niña cycles in the tropical eastern Pacific. When the tropical eastern Pacific is warmer than usual (El Niño years), California receives more precipitation in winter and vice versa for La Niña. However, California recently experienced two highly unusual winter seasons that puzzled climate scientists. Following a failed rainy season prediction despite the strong 2015–16 El Niño, California unexpectedly experienced one of its wettest winter seasons on record during the weak 2016–17 La Niña. The record broke the severe multi-year California drought, bringing water level conditions back to near normal for the first time since the winter of 2012–13. The seasonal forecast systems, which are largely based on El Niño/La Niña conditions, failed to predict these unusual winter precipitation patterns. The immediate questions are what happened during these two winters and why did our understanding of the tropical Pacific modulation of California winter precipitation not hold true for these two winters?
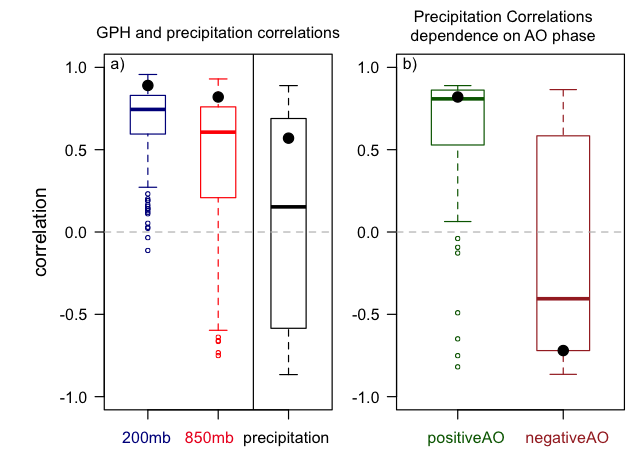
In a recent Geophysical Research Letters article, Singh and co-authors examined how well one of the state‐of‐the‐art forecast systems, the UK Meteorological Office’s global seasonal forecast system version 5 (GloSea5), captured the large‐scale atmospheric circulation and winter precipitation in California. The authors focused on the contrasts between the unexpectedly dry 2015–16 winter and the enormously wet 2016–17 winter, and used a large ensemble of forecasts made by the GloSea5 system to illustrate how the forecast system captures the difference between these two winters. They found that the seasonal forecast system can reproduce the large‐scale circulation differences in the North Pacific‐American domain but was not able to accurately predict the seasonal precipitation differences in California (see left panel in the plot). They further identified that the Arctic Oscillation (AO), a seesaw pressure pattern between the polar regions and the mid-latitudes, is essential in getting an accurate California winter precipitation prediction (right panel of the plot). When the AO phase is correctly captured by the forecast system (positive AO), California precipitation is well forecast by the GloSea5 system, but when the AO phase is incorrectly represented in the model (negative phase of AO), California precipitation prediction was mostly opposite to what actually happened. The AO phases can be a result of random internal atmospheric variability, thus may not be easily predictable. Some skill in AO seasonal predictions, though, has been demonstrated in recent years. El Niño and La Niña conditions and Arctic sea ice cover all seem to influence the AO. Thus, the interplay between the tropics, the Arctic, and California precipitation patterns can present a difficult challenge and interesting opportunity for both forecast models and our general understanding of these interactions. Future improvements in the representation of these interactions, and the processes by which they are predictable, can help improve seasonal predictions of California precipitation and provide useful information to those who manage California's water resources and infrastructure.
California Winter Precipitation Predictability: Insights From the Anomalous 2015–2016 and 2016–2017 Seasons (Geophysical Research Letters)
1 Washington State University
2Lamont Doherty Earth Observatory, Columbia University
3Met Office Hadley Centre, UK
Topics
- Sea Ice
- Weather
- Modeling
- Arctic
- Air-Sea
- ENSO