Global patterns of evaporation and precipitation leave a traceable isotopic fingerprint
As the planet warms, regional imbalances in precipitation (P) and evaporation (E) are expected to become larger. This will drive an overall intensification of the water cycle, resulting in more stormy weather. However, it is difficult to know how quickly the water cycle will respond to climate change without fully understanding how sensitively it has responded in the past. Now research suggests the isotope ratios of hydrogen and oxygen in water—which are preserved in ice cores and other records of past climate—can provide important clues about such water cycle changes.
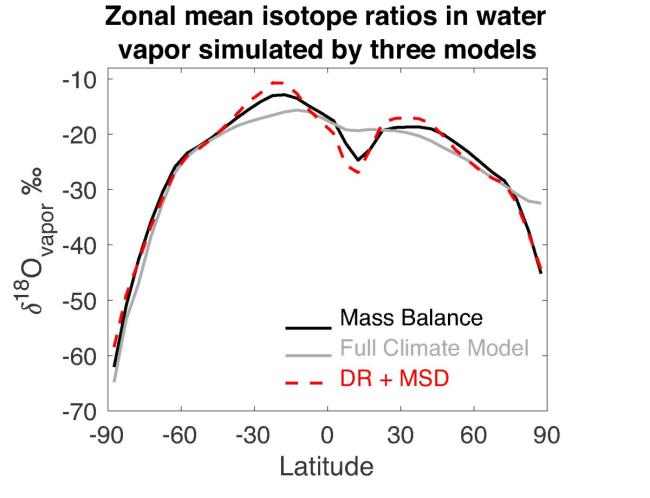
Using principles of mass balance, a new study in Geophysical Research Letters shows that spatial patterns of P and E determine pole-to-pole variations in isotope ratios of water vapor and precipitation. Patterns of P and E shape the atmosphere’s isotopic composition by changing two critical factors: the efficiency with which precipitation dries the atmosphere (the drying ratio) and the probability that moisture, once evaporated from the ocean surface, is transported downwind.
When transport increases, moisture effectively travels longer distances before raining out. As a result, moisture observed at any one location is likely to have been sourced from farther away. The new study shows that a simple linear model that accounts for changes in mean source distance, as well as the local drying ratio, can successfully replicate water isotopic variations in space and time.
Conceptualizing isotopic variability in terms of mean source distance and drying ratio also helps explain why water isotope ratios tend to correlate positively with precipitation and temperature in mid-latitude and polar regions but negatively with precipitation in the tropics. In low-latitude environments, the local drying ratio is a much stronger control on water isotope ratios than the mean source distance. As a result, as precipitation intensifies, isotope ratios in both water vapor and precipitation decrease. In contrast, high-latitude isotope ratios show stronger sensitivities to how much moisture is transported from afar, which depends on the energetics of the climate system.
Despite these generalities, isotope ratios nearly everywhere are shaped by some combination of local and remote water cycle drivers. This makes for a tricky interpretation of hydroclimate variability if isotopic observations are only available from a single location. However, the study is quick to point out that scientists can successfully untangle isotopic variations due to local and remote changes in P and E by using a spatially broad network of measurements—for example, one that spans multiple latitude bands.
Patterns of evaporation and precipitation drive global isotopic changes in atmospheric moisture (Geophysical Research Letters)
1NCAR
2Dartmouth College
Topics
- Paleo
- Water Cycle
- Modeling
- Climate Change