
Reconstructing the past 200 years of global weather

Key features of the climate system such as extreme weather events and phenomena are at the forefront of climate change research. “Reanalyses” provide a global reconstruction of past weather by combining first guesses from a modern numerical weather prediction system with actual observations using a process called “data assimilation”. By assimilating only surface pressure observations into an NOAA atmospheric model with prescribed sea surface temperatures, sea ice concentration, and radiative forcings, scientists from the University of Colorado Cooperative Institute for Research in Environmental Sciences (CIRES) at the NOAA Earth System Research Laboratory, collaborating with international partners, have generated global, 3-hourly estimates of the Earth system back to 1836 at about 75 km resolution, as well as internal estimates of confidence and uncertainty. This dataset recreates a 180-year history of temperature, precipitation, winds, humidity, and many other variables from below the land surface to the top of the atmosphere.

Reconstructions of the weather on February 10, 1936 at 12 UTC
Reconstructions of the weather on February 10, 1936 at 12 UTC, during the coldest February on record in the contiguous United States. The top panel shows a sea level pressure “confidence” map as analyzed by the NOAA-CIRES-DOE 20th Century Reanalysis version 3 (20CRv3). Black contours show ensemble mean sea level pressure with the 1000 hPa contour thickened and a contour interval of 5 hPa. Teal circles show locations of pressure observations that were assimilated within the prior 15 hours (with increasing transparency further back in time.) Shading represents the sea level pressure “confidence” as a unitless, climatologically-normalized function of ensemble standard deviation. Red shading represents confidence levels equivalent to a climate model simulation. Brighter orange and yellow shading represent higher confidence, and darker gray and purple shading represent lower confidence. The bottom left panel is a real-time US Daily Weather Map valid on February 10, 1936. The bottom center and right panels show ensemble mean estimates from 20CRv3 of the 2 m air temperature and 6-hour accumulation of precipitation, respectively, over the US for the same date.

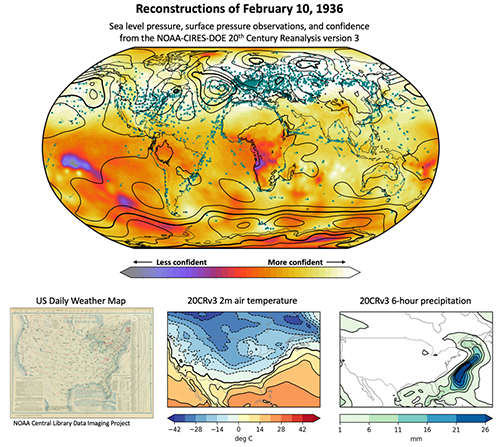
In a new article recently published in the Quarterly Journal of the Royal Meteorological Society, the authors explain how they generated the new Version 3 of the NOAA-CIRES-DOE 20th Century Reanalysis (20CRv3) by combining surface pressure observations with a modern numerical weather prediction system. The improvements over the previous version are illustrated by more consistent uncertainty estimates, smaller errors, and more accurate representations of storms. The dataset also assimilates millions more pressure observations, which represent an increase of 25% more observations per six hours in years prior to 1930. Many of these new observations were rescued and digitized by citizen scientists (e.g. www.oldweather.org), thus increasing users’ confidence in sparsely-observed regions of the globe such as the Arctic and Southern Hemisphere.

By providing 3-hourly estimates of the global weather over a 180-year period, the 20th Century Reanalysis allows researchers to study climate trends, historic storms, and how the frequency and quality of extreme events are changing over time. The dataset provides a crucial instrument-based link between paleo reconstructions and climate model projections, and can be used as verification for both. Older versions of this dataset have been used to study the 1816 Year Without a Summer, the 1930s Dust Bowl, the 1920-1930s Arctic warming, coastal defense planning, renewable energy, risk assessments for insurance and reinsurance purposes, disease tracking, El Niño Southern Oscillation and the Madden-Julian Oscillation.

Experiments reconstructing 1806-1835 are ongoing, but data for the years 1836-2015 from the new version 3 of the 20th Century Reanalysis are now available online at https://go.usa.gov/XTd. Ensemble statistics for many variables can be directly downloaded. Tools for generating plots online are also available.

Written by
Laura Slivinski, The University of Colorado Cooperative Institute for Research in Environmental Sciences at the NOAA Earth System Research Laboratory

Laura C. Slivinski1,2, Gilbert P. Compo1,2, Jeffrey S. Whitaker2, Prashant D. Sardeshmukh1,2, Benjamin S. Giese3, Chesley McColl1,2, Rob Allan4, Xungang Yin5,6, Russell Vose6, Holly Titchner4, John Kennedy4, Lawrence J. Spencer1,2, Linden Ashcroft7, Stefan Brönnimann8, Manola Brunet9,10, Dario Camuffo11, Richard Cornes12, Thomas A. Cram13, Richard Crouthamel14, Fernando Domínguez-Castro15, J. Eric Freeman5,6, Joëlle Gergis16,17, Ed Hawkins18, Philip D. Jones10, Sylvie Jourdain19, Alexey Kaplan20, Hisayuki Kubota21, Frank Le Blancq22, Tsz-Cheung Lee23, Andrew Lorrey24, Jürg Luterbacher25, Maurizio Maugeri26, Cary J. Mock27, G.W. Kent Moore28, Rajmund Przybylak29, Christa Pudmenzky30, Chris Reason31, Victoria C. Slonosky32, Catherine A. Smith1,2, Birger Tinz33, Blair Trewin7, Maria Antónia Valente34, Xiaolan L. Wang35, Clive Wilkinson10, Kevin Wood36,37, Przemysław Wyszýnski29

1Cooperative Institute for Research in Environmental Sciences, University of Colorado, Boulder, Colorado, USA
2Physical Sciences Division, NOAA Earth System Research Laboratory, Boulder, Colorado, USA
3Texas A&M University, College Station, Texas, USA
4Hadley Centre, Met Office, Exeter, UK
5Riverside Technology Inc, Asheville, North Carolina, USA
6National Centers for Environmental Information, Asheville, North Carolina, USA
7School of Earth Sciences, University of Melbourne, Australia
8Oeschger Centre for Climate Change Research and Institute of Geography, University of Bern, Switzerland
9Centre for Climate Change, Universitat Rovira i Virgili, Tarragona, Spain
10Climatic Research Unit, University of East Anglia, Norwich, UK
11National Research Council, Institute of Atmospheric Sciences and Climate, Padua, Italy
12National Oceanography Centre, Southampton, UK
13National Center for Atmospheric Research, Boulder, Colorado, USA
14International Environmental Data Rescue Organization, Deale, Maryland, USA
15Instituto Pirenaico de Ecología, Zaragoza, Spain
16Fenner School of Environment & Society, Australian National University, Australia
17ARC Centre of Excellence for Climate Extremes, Australian National University, Australia
18National Centre for Atmospheric Science, Department of Meteorology, University of Reading, UK
19Direction de la Climatologie et des Service Climatiques, Météo-France, Toulouse, France
20Lamont-Doherty Earth Observatory of Columbia University, Palisades, New York, USA
21Hokkaido University, Sapporo, Japan
22States of Jersey Meteorological Department, Jersey, UK
23Hong Kong Observatory, Hong Kong, China
24National Institute of Water and Atmospheric Research, Auckland, New Zealand
25Department of Geography, Climatology, Climate Dynamics and Climate Change and Centre of International Development and Environmental Research, Justus Liebig University of Giessen, Germany
26Department of Environmental Science and Policy, Università degli Studi di Milano, Italy
27Department of Geography, University of South Carolina, USA
28Department of Physics, University of Toronto, Canada
29Department of Meteorology and Climatology, Nicolaus Copernicus University, Torún, Poland
30Centre for Applied Climate Sciences, University of Southern Queensland, Australia
31Department of Oceanography, University of Cape Town, South Africa
32Centre for Interdisciplinary Studies of Montreal, McGill University, Montreal, Canada
33Deutscher Wetterdienst, Hamburg, Germany
34Instituto Dom Luiz, Faculdade de Ciênciasda Universidade de Lisboa, Portugal
35Environment and Climate Change Canada, Toronto, Canada
36NOAA Pacific Marine Environmental Laboratory, Seattle, Washington, USA
37Joint Institute for the Study of the Atmosphere and Ocean, University of Washington, USA